
Debugging Kotlin Apps with the Kotzilla Platform
Debugging Kotlin Apps with the Kotzilla Platform 관련

As the Kotlin language has grown, the projects built with it have become increasingly complex. And with that complexity comes new debugging headaches. Kotlin devs have to juggle a bunch of different tools, each with their own limitations, just to try and get to the bottom of performance issues, memory leaks, and architectural problems.
Debugging in mobile app development
Debugging is fundamentally a problem-solving process with these stages:
- Problem identification: recognizing that an issue exists, which can result from user feedback, automated testing, or dedicated tools.
- Root cause analysis: you then must distinguish between symptoms and underlying causes, employing various strategies such as hypotheses testing, trace analysis, and state monitoring.
- Solution implementation: After pinpointing the root cause, you'll typically implement a fix, often requiring modifications to the codebase or resource allocation strategies.
- Verification and validation: Finally, you test your solution in the context of the application to confirm that the issue has been resolved and that no new problems have been introduce.
Debugging in Development
The Android Studio debugger is built-in, but it can be really intrusive, especially when you're dealing with highly optimized, multithreaded code.
In Android Studio, debugging typically begins with println statements to gain initial insights into issues. After this, you'd transition to Android Studio’s built-in debugger for a more interactive and effective troubleshooting process.
The AndroidStudio Debugger lets you
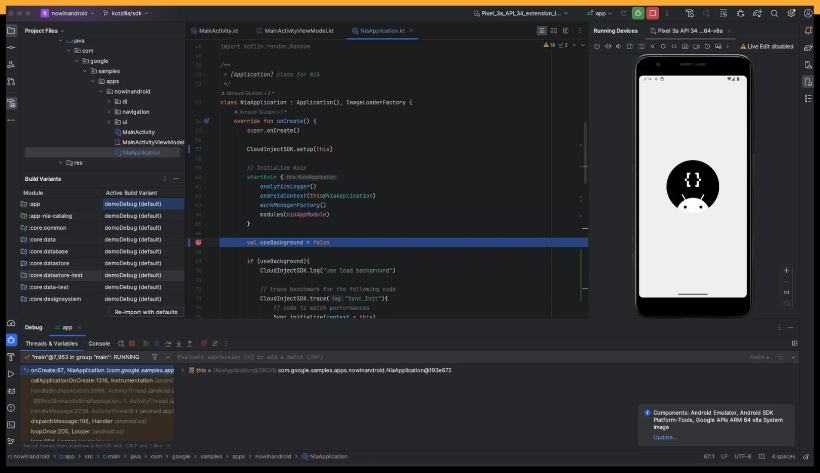
- Navigate through your code using step over, step into and step out controls to execute line by line, enter functions, or return to the caller function.
- Inspect the state of variables during runtime when execution is paused, including complex objects and data structures.
- View the call stack to trace the sequence of function calls leading to the current execution point.
- Attach the debugger to an already running app to debug issues as they occur without restarting the application.
Limitations of AndroidStudio debugger include
- Performance overhead: Instrumenting code for debugging can introduce significant overhead, potentially masking real-world performance issues. This is especially problematic in performance-sensitive applications or when debugging production apps.
- Inconsistent breakpoint functionality: Breakpoints can be unreliable in highly optimized code, with their behavior varying depending on compilation settings. This makes it difficult to capture the execution flow accurately.
Debugging in production
Once an application is deployed, debugging shifts focus from development to observing application behavior in real-world scenarios. Observability platforms provide insights into performance and help identify issues that may not be apparent during development.While they are great for monitoring production and analyzing crashes, they also often fall short when it comes to the nuanced debugging of component lifecycles and thread interactions.
With observability tools you get
Crash reporting: Observability tools almost always include crash reporting features that provide detailed information about application crashes, including stack traces helping pinpoint where in the code the app crashed.
Performance monitoring: They track different performance metrics, such as app startup time, UI response times, and memory usage, allowing developers to identify slow rendering times or long network calls
Error tracking and logging: With custom logging and error tracking, you can capture and monitor errors that don’t cause the app to crash but still negatively impact user experience (e.g., failed API requests, timeouts).
Distributed tracing: Distributed tracing allows you to follow requests through different services (e.g., between the mobile app and backend APIs), which is important for debugging interactions between the client and server.
Real User Monitoring (RUM): They often provide features capturing user interactions with the mobile app, allowing you to identify specific slowdowns or crashes experienced by users on various devices or operating systems.
Limitations of observability tools include:
- Complex thread management: Observability tools often struggle to visualize and manage multiple threads simultaneously, making it hard to analyze their interactions.
- Component lifecycle visibility limitations: These tools often lack the depth needed to effectively trace component lifecycle states and interactions, leading to undetected issues such as memory leaks or performance bottlenecks during lifecycle transitions.
- Manual tracing and instrumentation: To diagnose delays and issues in components like ViewModels or dependencies, custom traces are often required, adding manual overhead to the debugging process.
Enter the Kotzilla Platform
The Kotzilla Platform is a debugging tool built on top of the Koin dependency injection framework, which a lot of Kotlin devs already use. So it integrates seamlessly with your existing architecture, automatically collecting all the data it needs without any extra instrumentation or overhead.
This allows the Kotzilla Platform to give you detailed, contextual insights into what's going on under the hood - things like thread performance problems, memory leaks, and structural issues caused by overly complex dependency graphs or misused component lifecycles. It helps you quickly trace those issues back to the root cause, even in live production.
What Does the Kotzilla Platform Do?
The Kotzilla Platform is a pretty comprehensive debugging tool designed specifically for Kotlin developers. It offers a unified approach that bridges the gap between development and production environments, providing insights and tools to tackle the unique issues of Kotlin app development.
By using Koin's container, the Kotzilla SDK automatically collects essential data about your application's behavior without any intrusive instrumentation or performance overhead. This allows the platform to provide you with detailed, contextual insights into the inner workings of your Kotlin app.
What are the Kotzilla Platform's benefits
Ok, let's talk turkey.
As discussed, one of the standout features of the Kotzilla Platform is its ability to identify and resolve issues in your Kotlin app's before they affect your users.
Want to see it in action? Let’s walk through a real-world example based on the NowInAndroid app for Koin (kotzilla-io/nowinandroid). The following sections assume that the first two setup steps of this Getting started tutorial have already been completed.
Detecting a screen freeze in the app
When the main UI thread is blocked by time-intensive operations, the app can freeze or slow down, often leading to ANR (App Not Responding) events. Common causes include heavy computations or synchronous operations running on the main thread. [

Screen freezes severely degrade user experience and can lead to negative app reviews, higher uninstall rates, and reduced app store rankings.
To demonstrate how the platform works, we'll
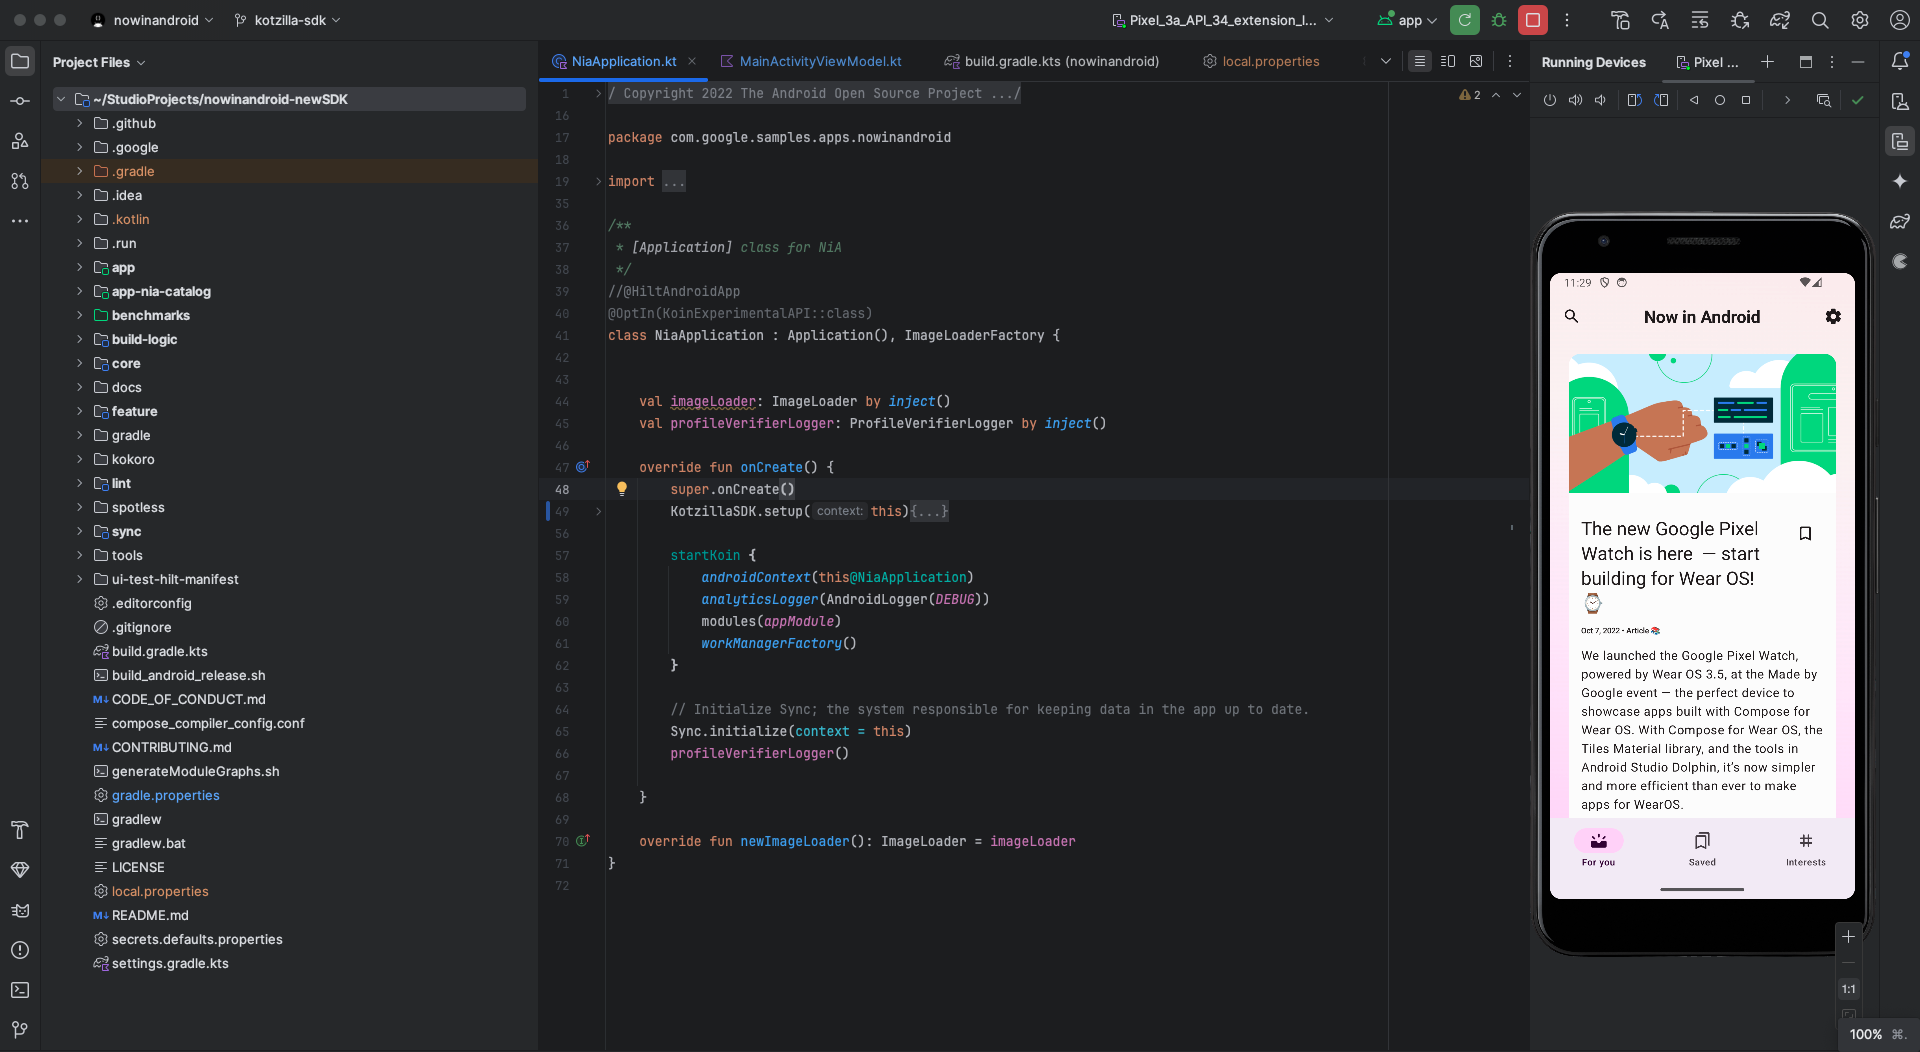
- Simulate a 1-second delay in the MainActivityViewModel of the NowInAndroid app. This delay simulates a blocking operation in the ViewModel running on the main thread, which will degrade app performance.
class MainActivityViewModel(
    userDataRepository: UserDataRepository,
): ViewModel() {
    init {
        // Introduce a 1-second delay to simulate a main-thread block
        Thread.sleep(1000)
    }
}
Observing the issue on the Kotzilla Platform
Log in to the Kotzilla Platform and navigate to your app’s Dashboard. From there, open the Sessions View to review user sessions.

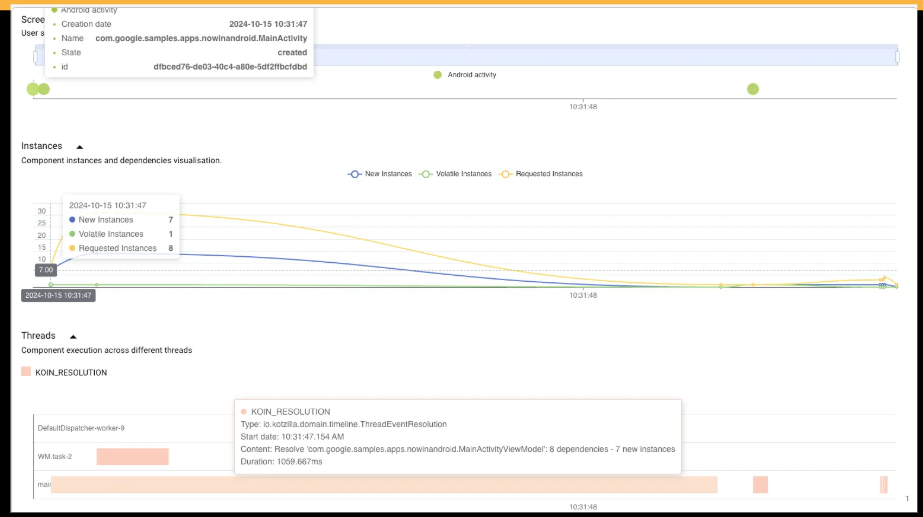
MainActivity. This gap reveals a period where the app appears unresponsive to the user. In the Threads view, notice the delay in the initialization of the MainActivityViewModel component.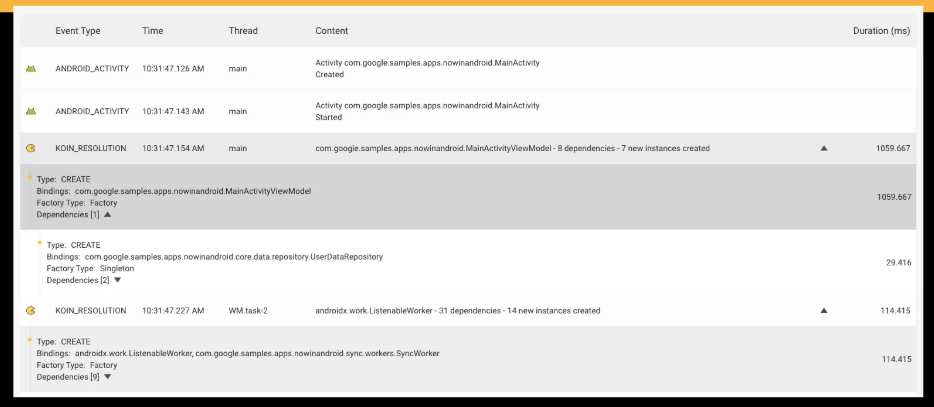
MainActivityViewModelYou can try the Kotzilla Platform here for free. We'd love to hear what you think once you have. Maybe what other features you'd like to see?