Introduction to Distributed Tracing With OpenTelemetry in .NET
Introduction to Distributed Tracing With OpenTelemetry in .NET 관련

If you're building or maintaining distributed .NET applications, understanding how they behave is key to ensuring reliability and performance.
Distributed systems offer flexibility but introduce complexity, making troubleshooting a headache. Understanding how requests flow through your system is crucial for debugging and performance optimization.
OpenTelemetry is an open-source observability framework that makes this possible.
In this article, we'll dive into what OpenTelemetry is, how to use it in your .NET projects, and the powerful insights it provides.
OpenTelemetry Introduction
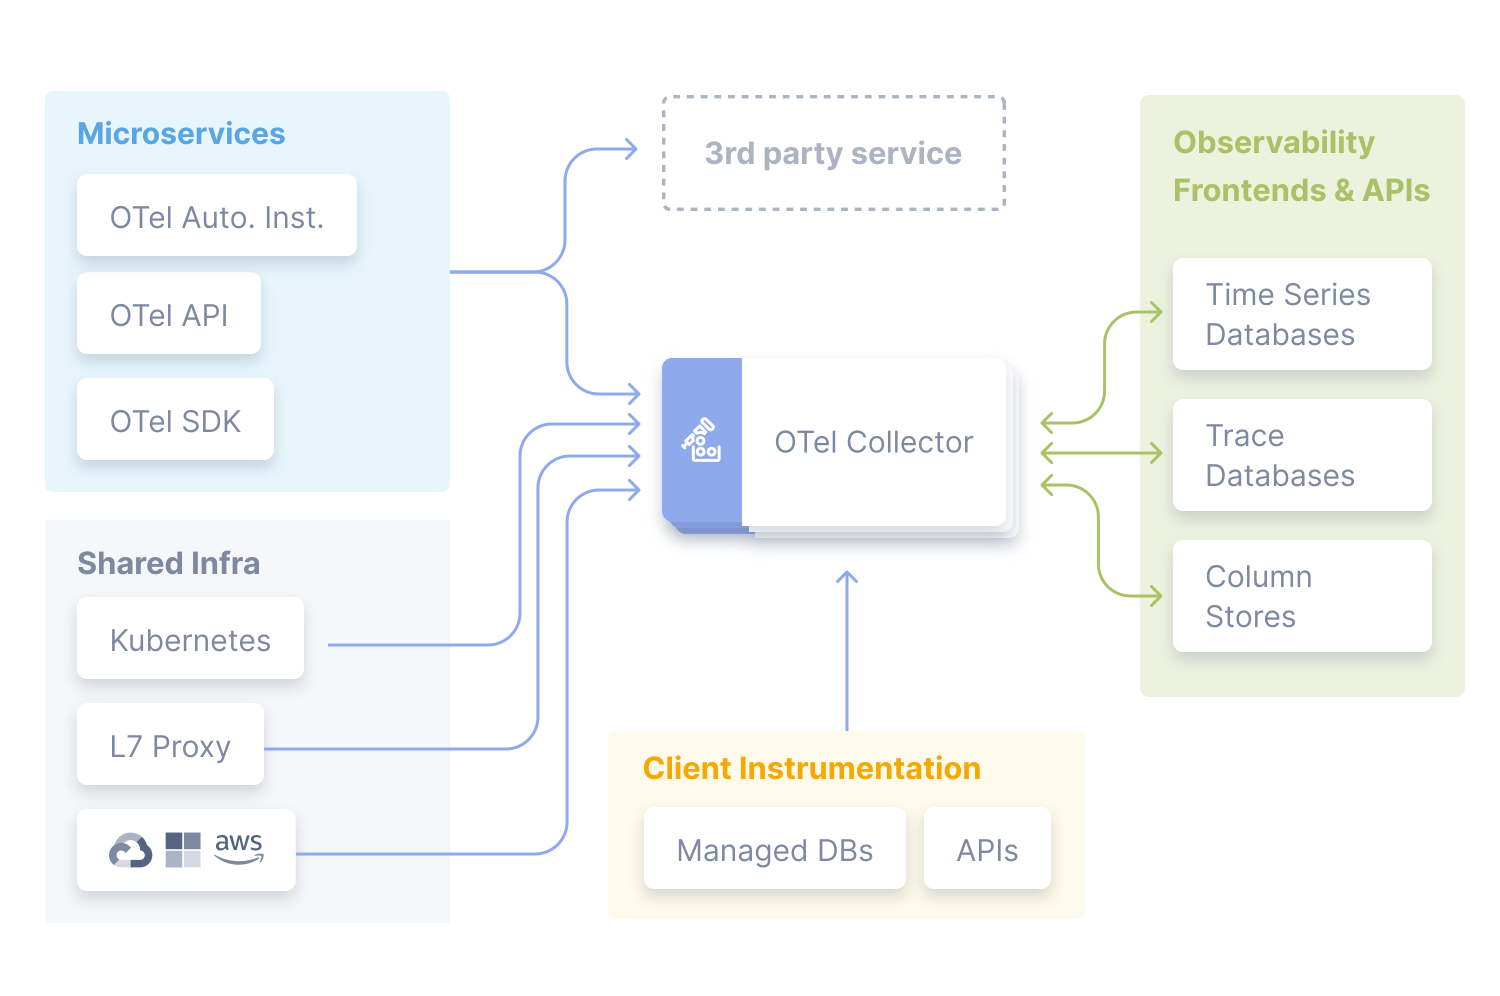
OpenTelemetry (OTel) is a vendor-neutral, open-source standard for instrumenting applications to generate telemetry data. OpenTelemetry contains APIs, SDKs, tools, and integrations for creating and managing this telemetry data (traces, metrics, and logs).
Telemetry data includes:
- Traces: Represent the flow of requests through distributed systems, showing timings and relationships between services.
- Metrics: Numerical measurements of system behavior over time (e.g., request counts, error rates, memory usage).
- Logs: Textual records of events with rich contextual information. Structured logs.

Source: https://opentelemetry.io/docs/
OpenTelemetry provides a unified way to collect this data, making it easier to understand the behavior and health of complex distributed applications.
We can export the telemetry data we are collecting to a service capable of processing it and providing us with an interface to analyze it.
We're going to configure OpenTelemetry to export traces directly to Jaeger.
Adding OpenTelemetry to .NET Applications
OpenTelemetry provides libraries and SDKs to add code (instrumentation) into your .NET applications. These instrumentations automatically capture the traces, metrics, and logs we are interested in.
We're going to install the following NuGet packages:
# Automatic tracing, metrics
Install-Package OpenTelemetry.Extensions.Hosting

# Telemetry data exporter
Install-Package OpenTelemetry.Exporter.OpenTelemetryProtocol

# Instrumentation packages
Install-Package OpenTelemetry.Instrumentation.Http
Install-Package OpenTelemetry.Instrumentation.AspNetCore
Install-Package OpenTelemetry.Instrumentation.EntityFrameworkCore
Install-Package OpenTelemetry.Instrumentation.StackExchangeRedis
Install-Package Npgsql.OpenTelemetry
Once we have these NuGet packages installed, it's time to configure some services.
services
    .AddOpenTelemetry()
    .ConfigureResource(resource => resource.AddService(serviceName))
    .WithTracing(tracing =>
    {
        tracing
            .AddAspNetCoreInstrumentation()
            .AddHttpClientInstrumentation()
            .AddEntityFrameworkCoreInstrumentation()
            .AddRedisInstrumentation()
            .AddNpgsql();

        tracing.AddOtlpExporter();
    });
AddAspNetCoreInstrumentation- This enables ASP.NET Core instrumentation.AddHttpClientInstrumentation- This enablesHttpClientinstrumentation for outgoing requests.AddEntityFrameworkCoreInstrumentation- This enables EF Core instrumentation.AddRedisInstrumentation- This enables Redis instrumentation.AddNpgsql- This enables PostgreSQL instrumentation.
With all of these instrumentations configured, our application will start collecting a lot of valuable traces at runtime.
We also need to configure an environment variable for the exporter added with AddOtlpExporter to work correctly. We can set OTEL_EXPORTER_OTLP_ENDPOINT through application settings. The address specified here will point to a local Jaeger instance.
OTEL_EXPORTER_OTLP_ENDPOINT=http://localhost:4317
Running Jaeger Locally
Jaeger is an open source, distributed tracing platform. Jaeger maps the flow of requests and data as they travel through a distributed system. These requests could be calling out to multiple services, and Jaeger knows how to piece all of this information together.
Here's how to run Jaeger inside a Docker container:
docker run -d -p 4317:4317 -p 16686:16686 jaegertracing/all-in-one:latest
We're using the jaegertracing/all-in-one:latest image, and exposing the 4317 to accept telemetry data. The Jaeger user interface will be exposed on the 16686 port.
Distributed Tracing
After installing the OpenTelemetry libraries and configuring tracing in our applications, we can send some requests to generate telemetry data. We can then access Jaeger to start analyzing our distributed traces.
Registering a new user
Here's an example of registering a new user with the system. We're accessing the API gateway (Evently.Gateway) service, which proxies the request to the Evently.Api service. And you can see that the Evently.Api service makes a few HTTP requests before persisting a new record in the database.

Publishing a message with MassTransit
Here's another distributed trace where we publish the UserRegisteredIntegrationEvent over a message bus. You can see that it's being consumed by two different services that write some data to the database.

Examining additional trace information
Distributed traces can include some useful contextual information. Here's an example trace representing a database command. This comes from the PostgreSQL instrumentation, and we can see the SQL query that we are executing.

Complex distributed traces
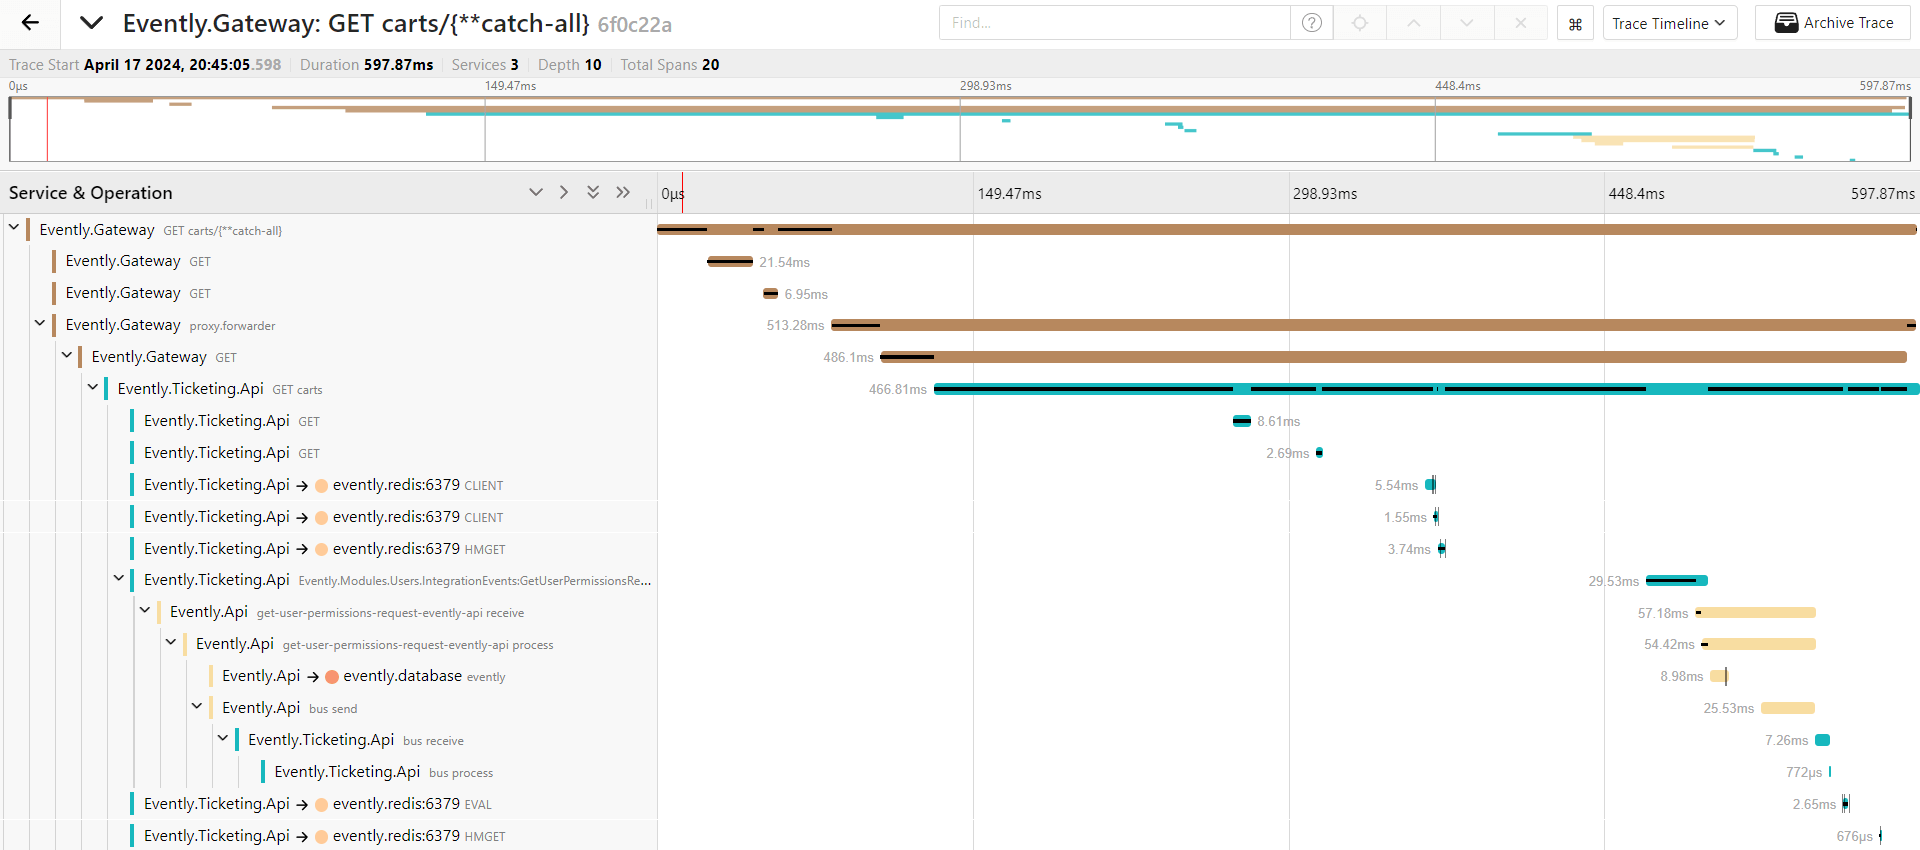
Here's a more complex distributed trace, which includes:
- Three .NET applications
- PostgreSQL database
- Redis distributed cache
We're sending a request to get the customer's cart. The request will first hit the API gateway, which proxies it to the Evently.Ticketing.Api service that owns the data. However, the Evently.Ticketing.Api service needs to reach out to the Evently.Api service to get the authorization information. And all of this leads to the distributed trace you can see below.

Summary
Understanding modern applications, especially distributed ones, can be a real mind-bender. OpenTelemetry is like having X-ray vision into your system.
While adding OpenTelemetry takes some upfront work, consider it an investment. That investment pays off big time when problems pop up. Instead of frantic guesswork, you have precise data to zero in on issues fast.
Is OpenTelemetry a magic bullet for all your problems? Nope.
But it's an excellent tool to add to your troubleshooting arsenal, especially as your .NET applications grow and get more complex.
If you're curious where the distributed traces come from, it's from the application we're building in my Modular Monolith course.
That's all for today. Stay awesome, and I'll see you next week.