5 Serilog Best Practices For Better Structured Logging
5 Serilog Best Practices For Better Structured Logging 관련


.Serilog is a structured logging library for .NET.
It's also my preferred logging library in the projects I'm developing.
Serilog supports many logging destinations called Sinks. (serilog/serilog)
The log destinations range from console and file sinks to managed logging services such as Application Insights. (serilog-contrib/serilog-sinks-applicationinsights)
Today, I want to share 5 practical tips for better structured logging with Serilog.
Use The Configuration System
There are two ways you can configure Serilog in ASP.NET Core:
- Fluent API
- Configuration system
The Fluent API allows you to write code and easily configure Serilog. The downside is you are hardcoding your configuration. Any configuration changes require deploying a new version.
I prefer using the ASP.NET configuration system to set up Serilog. The benefit is you can change the logging configuration without redeploying your application.
You'll need to install the Serilog.Settings.Configuration library.
This allows you to configure Serilog using the configuration system:
builder.Host.UseSerilog((context, loggerConfig) =>
    loggerConfig.ReadFrom.Configuration(context.Configuration));
Here's a Serilog configuration with Console (serilog/serilog-sinks-console) and Seq (datalust/serilog-sinks-seq) sinks.
We also configure a few Serilog enrichers (serilog/serilog)to enrich application logs with extra information.
{
  "Serilog": {
    "Using": ["Serilog.Sinks.Console", "Serilog.Sinks.Seq"],
    "MinimumLevel": {
      "Default": "Information",
      "Override": {
        "Microsoft": "Information"
      }
    },
    "WriteTo": [
      { "Name": "Console" },
      {
        "Name": "Seq",
        "Args": { "serverUrl": "http://localhost:5341" }
      }
    ],
    "Enrich": ["FromLogContext", "WithMachineName", "WithThreadId"]
  }
}
Use Serilog Request Logging
You can install the Serilog.AspNetCore library to add Serilog logging for the ASP.NET Core request pipeline. It adds ASP.NET's internal operations to the same Serilog sinks as your application events.
All you need to do is call the UseSerilogRequestLogging method:
app.UseSerilogRequestLogging();
The SourceContext for these structured logs is Serilog.AspNetCore.RequestLoggingMiddleware.
Here's an example structured log produced by this middleware:
{
  "@t": "2023-12-16T00:00:00.0000000Z",
  "@mt": "HTTP {RequestMethod} {RequestPath} responded {StatusCode} in {Elapsed:0.0000} ms",
  "@m": "HTTP POST /api/users responded 409 in 24.7928 ms",
  "@i": "37aa1435",
  "@r": ["24.7928"],
  "@tr": "61a449a8606fdb64e88d6c64b7b7354e",
  "@sp": "163ed90674cb12f6",
  "ConnectionId": "0HMVSP0L8FVEN",
  "CorrelationId": "0HMVSP0L8FVEN:0000000B",
  "Elapsed": 24.792778,
  "RequestId": "0HMVSP0L8FVEN:0000000B",
  "RequestMethod": "POST",
  "RequestPath": "/api/users",
  "SourceContext": "Serilog.AspNetCore.RequestLoggingMiddleware",
  "StatusCode": 409
}
Enrich Your Logs With CorrelationId
How can you track all the logs belonging to the same request?
You can add a CorrelationId property to your structured logs.
This also works across multiple applications. You need to pass the CorrelationId using an HTTP header. For example, you could use a custom X-Correlation-Id header.
In the RequestContextLoggingMiddleware, I'm adding the CorrelationId to the Serilog LogContext (serilog/serilog). This will make it available to all logs created during this application request.
public class RequestContextLoggingMiddleware
{
    private const string CorrelationIdHeaderName = "X-Correlation-Id";
    private readonly RequestDelegate _next;

    public RequestContextLoggingMiddleware(RequestDelegate next)
    {
        _next = next;
    }

    public Task Invoke(HttpContext context)
    {
        string correlationId = GetCorrelationId(context);

        using (LogContext.PushProperty("CorrelationId", correlationId))
        {
            return _next.Invoke(context);
        }
    }

    private static string GetCorrelationId(HttpContext context)
    {
        context.Request.Headers.TryGetValue(
            CorrelationIdHeaderName, out StringValues correlationId);

        return correlationId.FirstOrDefault() ?? context.TraceIdentifier;
    }
}
I like to create an extension method for adding the middleware. The UseRequestContextLogging method will add the RequestContextLoggingMiddleware to the request pipeline. Note that the order of registering middleware is important. If you want the CorrelationId in all your logs, you want to place this middleware at the start.
public static IApplicationBuilder UseRequestContextLogging(
    this IApplicationBuilder app)
{
    app.UseMiddleware<RequestContextLoggingMiddleware>();

    return app;
}
Log Important Application Events
In general, I try to log important events in my application. This includes current request information, errors, failures, unexpected values, branching points, etc.
I'm a proponent of using the Result pattern to express application failures. So, having a custom middleware to log request processing results is important.
Some developers prefer using exceptions to achieve the same functionality. I disagree with this. Using exceptions for flow control is a bad practice. But still, don't forget to add a global exception handler for unhandled exceptions.
If you're using the CQRS pattern with MediatR, you can easily add logging for all application requests.
In the RequestLoggingPipelineBehavior I'm pushing the Error property to the LogContext. The error object is deconstructed into a JSON value in the structured log. This lets me filter my logs based on the error details.
internal sealed class RequestLoggingPipelineBehavior<TRequest, TResponse>
    : IPipelineBehavior<TRequest, TResponse>
    where TRequest : class
    where TResponse : Result
{
    private readonly ILogger _logger;

    public RequestLoggingPipelineBehavior(ILogger logger)
    {
        _logger = logger;
    }

    public async Task<TResponse> Handle(
        TRequest request,
        RequestHandlerDelegate<TResponse> next,
        CancellationToken cancellationToken)
    {
        string requestName = typeof(TRequest).Name;

        _logger.LogInformation(
            "Processing request {RequestName}", requestName);

        TResponse result = await next();

        if (result.IsSuccess)
        {
            _logger.LogInformation(
                "Completed request {RequestName}", requestName);
        }
        else
        {
            using (LogContext.PushProperty("Error", result.Error, true))
            {
                _logger.LogError(
                    "Completed request {RequestName} with error", requestName);
            }
        }

        return result;
    }
}
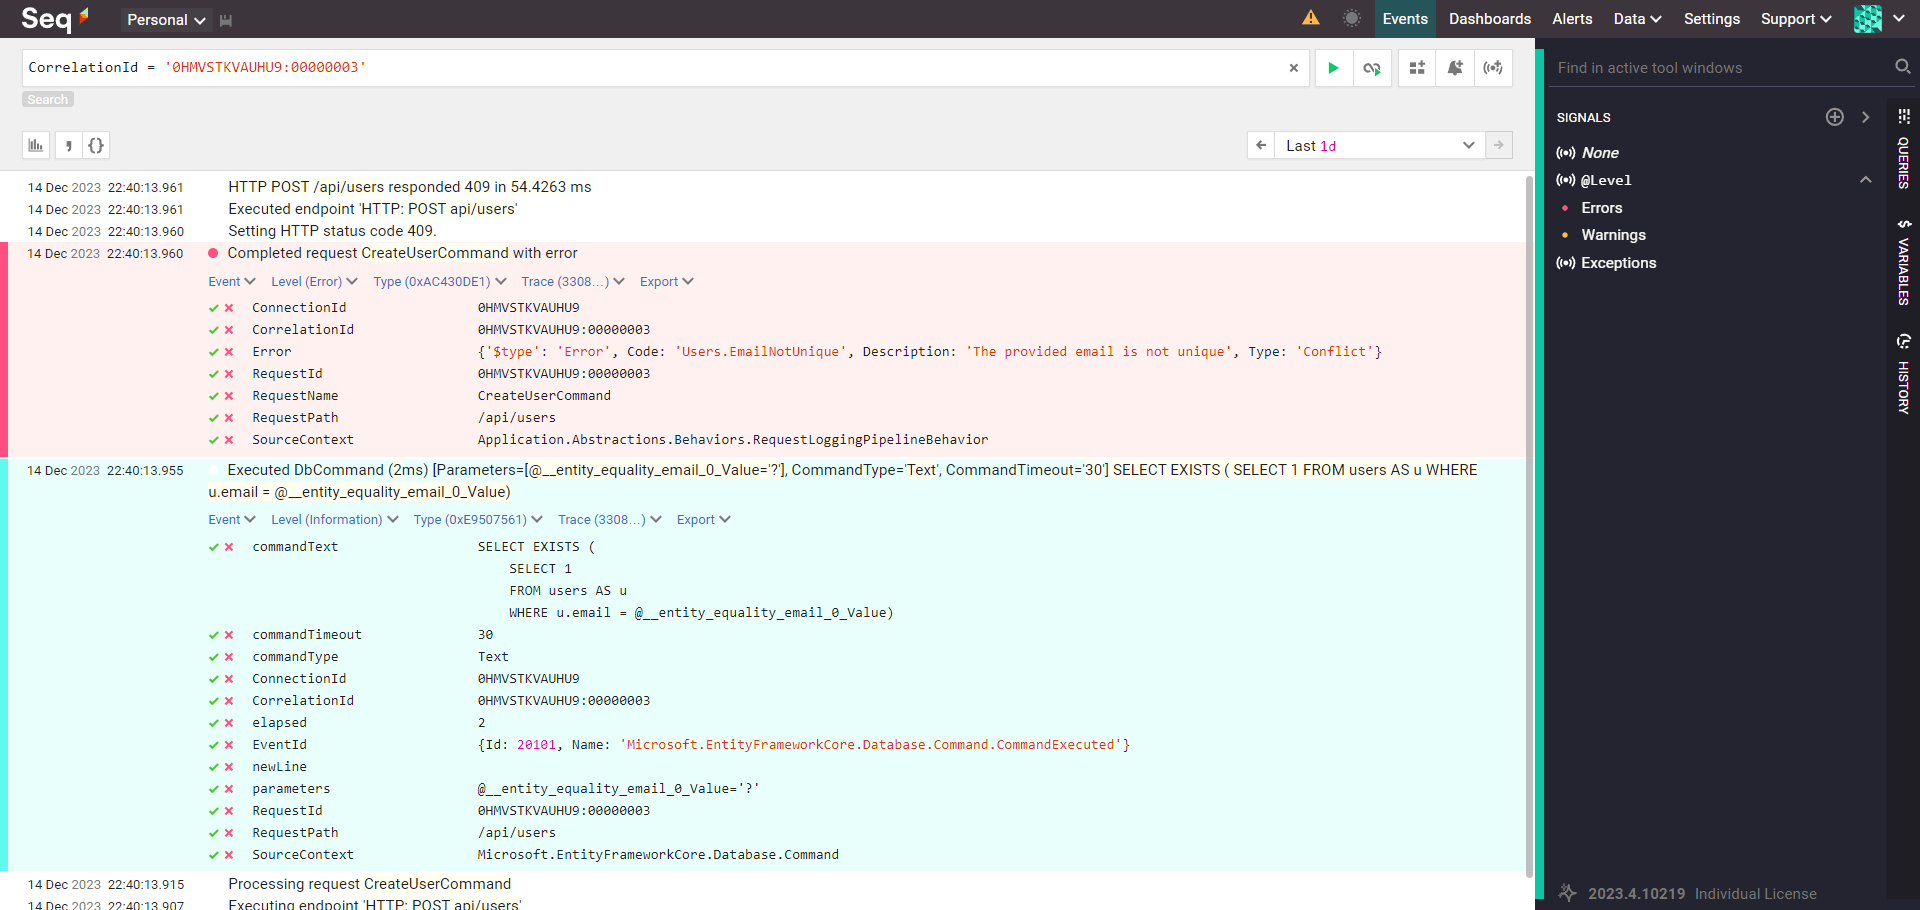
Use Seq for Local Development
.Seq is a self-hosted search, analysis, and alerting server built for structured log data. It's free to use for local development. It offers advanced search and filtering capabilities on the structured log data.
You can spin up a Seq instance in a Docker container:
version: '3.4'

services:
  seq:
    image: datalust/seq:latest
    container_name: seq
    environment:
      - ACCEPT_EULA=Y
    ports:
      - 5341:5341
      - 8081:80
You can start filtering data when you configure Serilog to write application logs to the Seq instance.
Summary
Structured logs follow follow the same structure. And since structured logs are machine-readable, you can search them for specific information. Structured logs provide more context and details about application errors. They make it easier to identify and fix problems.
You can use Serilog's powerful LogContext to enrich your logs with a CorrelationId. This lets you easily track all logs related to a single application request.
When you have structured logging set up, you'll want to search and analyze your logs. Seq is an excellent tool for this that you can use for local development.
If you want to get started with Seq, check out my beginner Seq tutorial.
Thanks for reading, and stay awesome!
