How to Build a Real-time Network Traffic Dashboard with Python and Streamlit
How to Build a Real-time Network Traffic Dashboard with Python and Streamlit 관련

Have you ever wanted to visualize your network traffic in real-time? In this tutorial, you will be learning how to build an interactive network traffic analysis dashboard with Python and streamlit. streamlit is an open-source Python framework you can use to develop web applications for data analysis and data processing.
By the end of this tutorial, you will know how to capture raw network packets from the NIC (Network Interface Card) of your computer, process the data, and create beautiful visualizations that will update in real-time.
Why is Network Traffic Analysis Important?
Network traffic analysis is a critical requirement in enterprises where networks form the backbone of nearly every application and service. At the core of it, we have analysis of network packets that involves monitoring the network, capturing all the traffic (ingress and egress), and interpreting these packets as they flow through a network. You can use this technique to identify security patterns, detect anomalies, and ensure the security and efficiency of the network.
This proof-of-concept project that we’ll work on in this tutorial is particularly useful since it helps you visualize and analyze network activity in real-time. And this will allow you to understand how troubleshooting issues, performance optimizations, and security analysis is done in enterprise systems.
Prerequisites
- Python 3.8 or a newer version installed on your system.
- A basic understanding of computer networking concepts.
- Familiarity with the Python programming language and its widely used libraries.
- Basic knowledge of data visualization techniques and libraries.
How to Setup your Project
To get started, create the project structure and install the necessary tools with Pip with the following commands:
mkdir network-dashboard
cd network-dashboard
pip install streamlit pandas scapy plotly
We will be using Streamlit for the dashboard visualizations, pandas for the data processing, scapy for network packet capturing and packet processing, and finally plotly for plotting charts with our collected data.
How to Build the Core Functionalities
We will be putting all of the code in a single file named dashboard.py. Firstly, let’s start by importing all the elements we will be using:
import streamlit as st
import pandas as pd
import plotly.express as px
import plotly.graph_objects as go
from scapy.all import *
from collections import defaultdict
import time
from datetime import datetime
import threading
import warnings
import logging
from typing import Dict, List, Optional
import socket
Now let’s configure logging by setting up a basic logging configuration. This will be used for tracking events and running our application in debug mode. We have currently set the logging level to be INFO, meaning that events with level INFO or higher will be displayed. If you are not familiar with logging in Python, I’d recommend checking out this documentation piece that goes in-depth.
# Configure logging
logging.basicConfig(
    level=logging.INFO,
    format='%(asctime)s - %(levelname)s - %(message)s'
)
logger = logging.getLogger(__name__)
Next, we’ll build our packet processor. We’ll implement the functionality of processing our captured packets in this class.
class PacketProcessor:
    """Process and analyze network packets"""

    def __init__(self):
        self.protocol_map = {
            1: 'ICMP',
            6: 'TCP',
            17: 'UDP'
        }
        self.packet_data = []
        self.start_time = datetime.now()
        self.packet_count = 0
        self.lock = threading.Lock()

    def get_protocol_name(self, protocol_num: int) -> str:
        """Convert protocol number to name"""
        return self.protocol_map.get(protocol_num, f'OTHER({protocol_num})')

    def process_packet(self, packet) -> None:
        """Process a single packet and extract relevant information"""
        try:
            if IP in packet:
                with self.lock:
                    packet_info = {
                        'timestamp': datetime.now(),
                        'source': packet[IP].src,
                        'destination': packet[IP].dst,
                        'protocol': self.get_protocol_name(packet[IP].proto),
                        'size': len(packet),
                        'time_relative': (datetime.now() - self.start_time).total_seconds()
                    }

                    # Add TCP-specific information
                    if TCP in packet:
                        packet_info.update({
                            'src_port': packet[TCP].sport,
                            'dst_port': packet[TCP].dport,
                            'tcp_flags': packet[TCP].flags
                        })

                    # Add UDP-specific information
                    elif UDP in packet:
                        packet_info.update({
                            'src_port': packet[UDP].sport,
                            'dst_port': packet[UDP].dport
                        })

                    self.packet_data.append(packet_info)
                    self.packet_count += 1

                    # Keep only last 10000 packets to prevent memory issues
                    if len(self.packet_data) > 10000:
                        self.packet_data.pop(0)

        except Exception as e:
            logger.error(f"Error processing packet: {str(e)}")

    def get_dataframe(self) -> pd.DataFrame:
        """Convert packet data to pandas DataFrame"""
        with self.lock:
            return pd.DataFrame(self.packet_data)
This class will build our core functionality and has several utility functions that will be used for processing the packets.
Network packets are categorized into two at transport level (TCP and UDP) and the ICMP protocol at the network level. If you are unfamiliar with the concepts of TCP/IP, I recommend checking out this article on freeCodeCamp News.
Our constructor will keep track of all packets seen that are categorized into these TCP/IP protocol type buckets that we defined. We’ll also take note of the packet capture time, the data captured, and the number of packets captured.
We’ll also be leveraging a thread lock to ensure that only one packet is processed at a single time. This can be further extended to enable the project to have parallel packet processing.
The get_protocol_name helper function helps us get the correct type of the protocol based on their protocol numbers. To give some background on this, the Internet Assigned Numbers Authority (IANA) assigns standardized numbers to identify different protocols in a network packet. As and when we see these numbers in the parsed network packet, we’ll know what kind of protocol is being used in the packet currently intercepted. For the scope of this project, we’ll be mapping to only TCP, UDP and ICMP (Ping). If we encounter any other type of packet, we’ll categorize it as OTHER(<protocol_num>).
The process_packet function handles our core functionality that will process these individual packets. If the packet contains an IP layer, it will take note of the source and destination IP addresses, protocol type, packet size, and time elapsed since the start of packet capturing.
For packets with specific transport layer protocols (like TCP and UDP), we will capture the source and destination ports along with TCP flags for TCP packets. These extracted details will be stored in memory in the packet_data list. We will also keep track of the packet_count as and when these packets are processed.
The get_dataframe function helps us to convert the packet_data list into a Pandas data-frame that will then be used for our visualization.
How to Create the Streamlit Visualizations
Now it’s time for us to build our interactive Streamlit Dashboard. We will define a function called create_visualization in the dashboard.py script (outside of our packet processing class).
def create_visualizations(df: pd.DataFrame):
    """Create all dashboard visualizations"""
    if len(df) > 0:
        # Protocol distribution
        protocol_counts = df['protocol'].value_counts()
        fig_protocol = px.pie(
            values=protocol_counts.values,
            names=protocol_counts.index,
            title="Protocol Distribution"
        )
        st.plotly_chart(fig_protocol, use_container_width=True)

        # Packets timeline
        df['timestamp'] = pd.to_datetime(df['timestamp'])
        df_grouped = df.groupby(df['timestamp'].dt.floor('S')).size()
        fig_timeline = px.line(
            x=df_grouped.index,
            y=df_grouped.values,
            title="Packets per Second"
        )
        st.plotly_chart(fig_timeline, use_container_width=True)

        # Top source IPs
        top_sources = df['source'].value_counts().head(10)
        fig_sources = px.bar(
            x=top_sources.index,
            y=top_sources.values,
            title="Top Source IP Addresses"
        )
        st.plotly_chart(fig_sources, use_container_width=True)
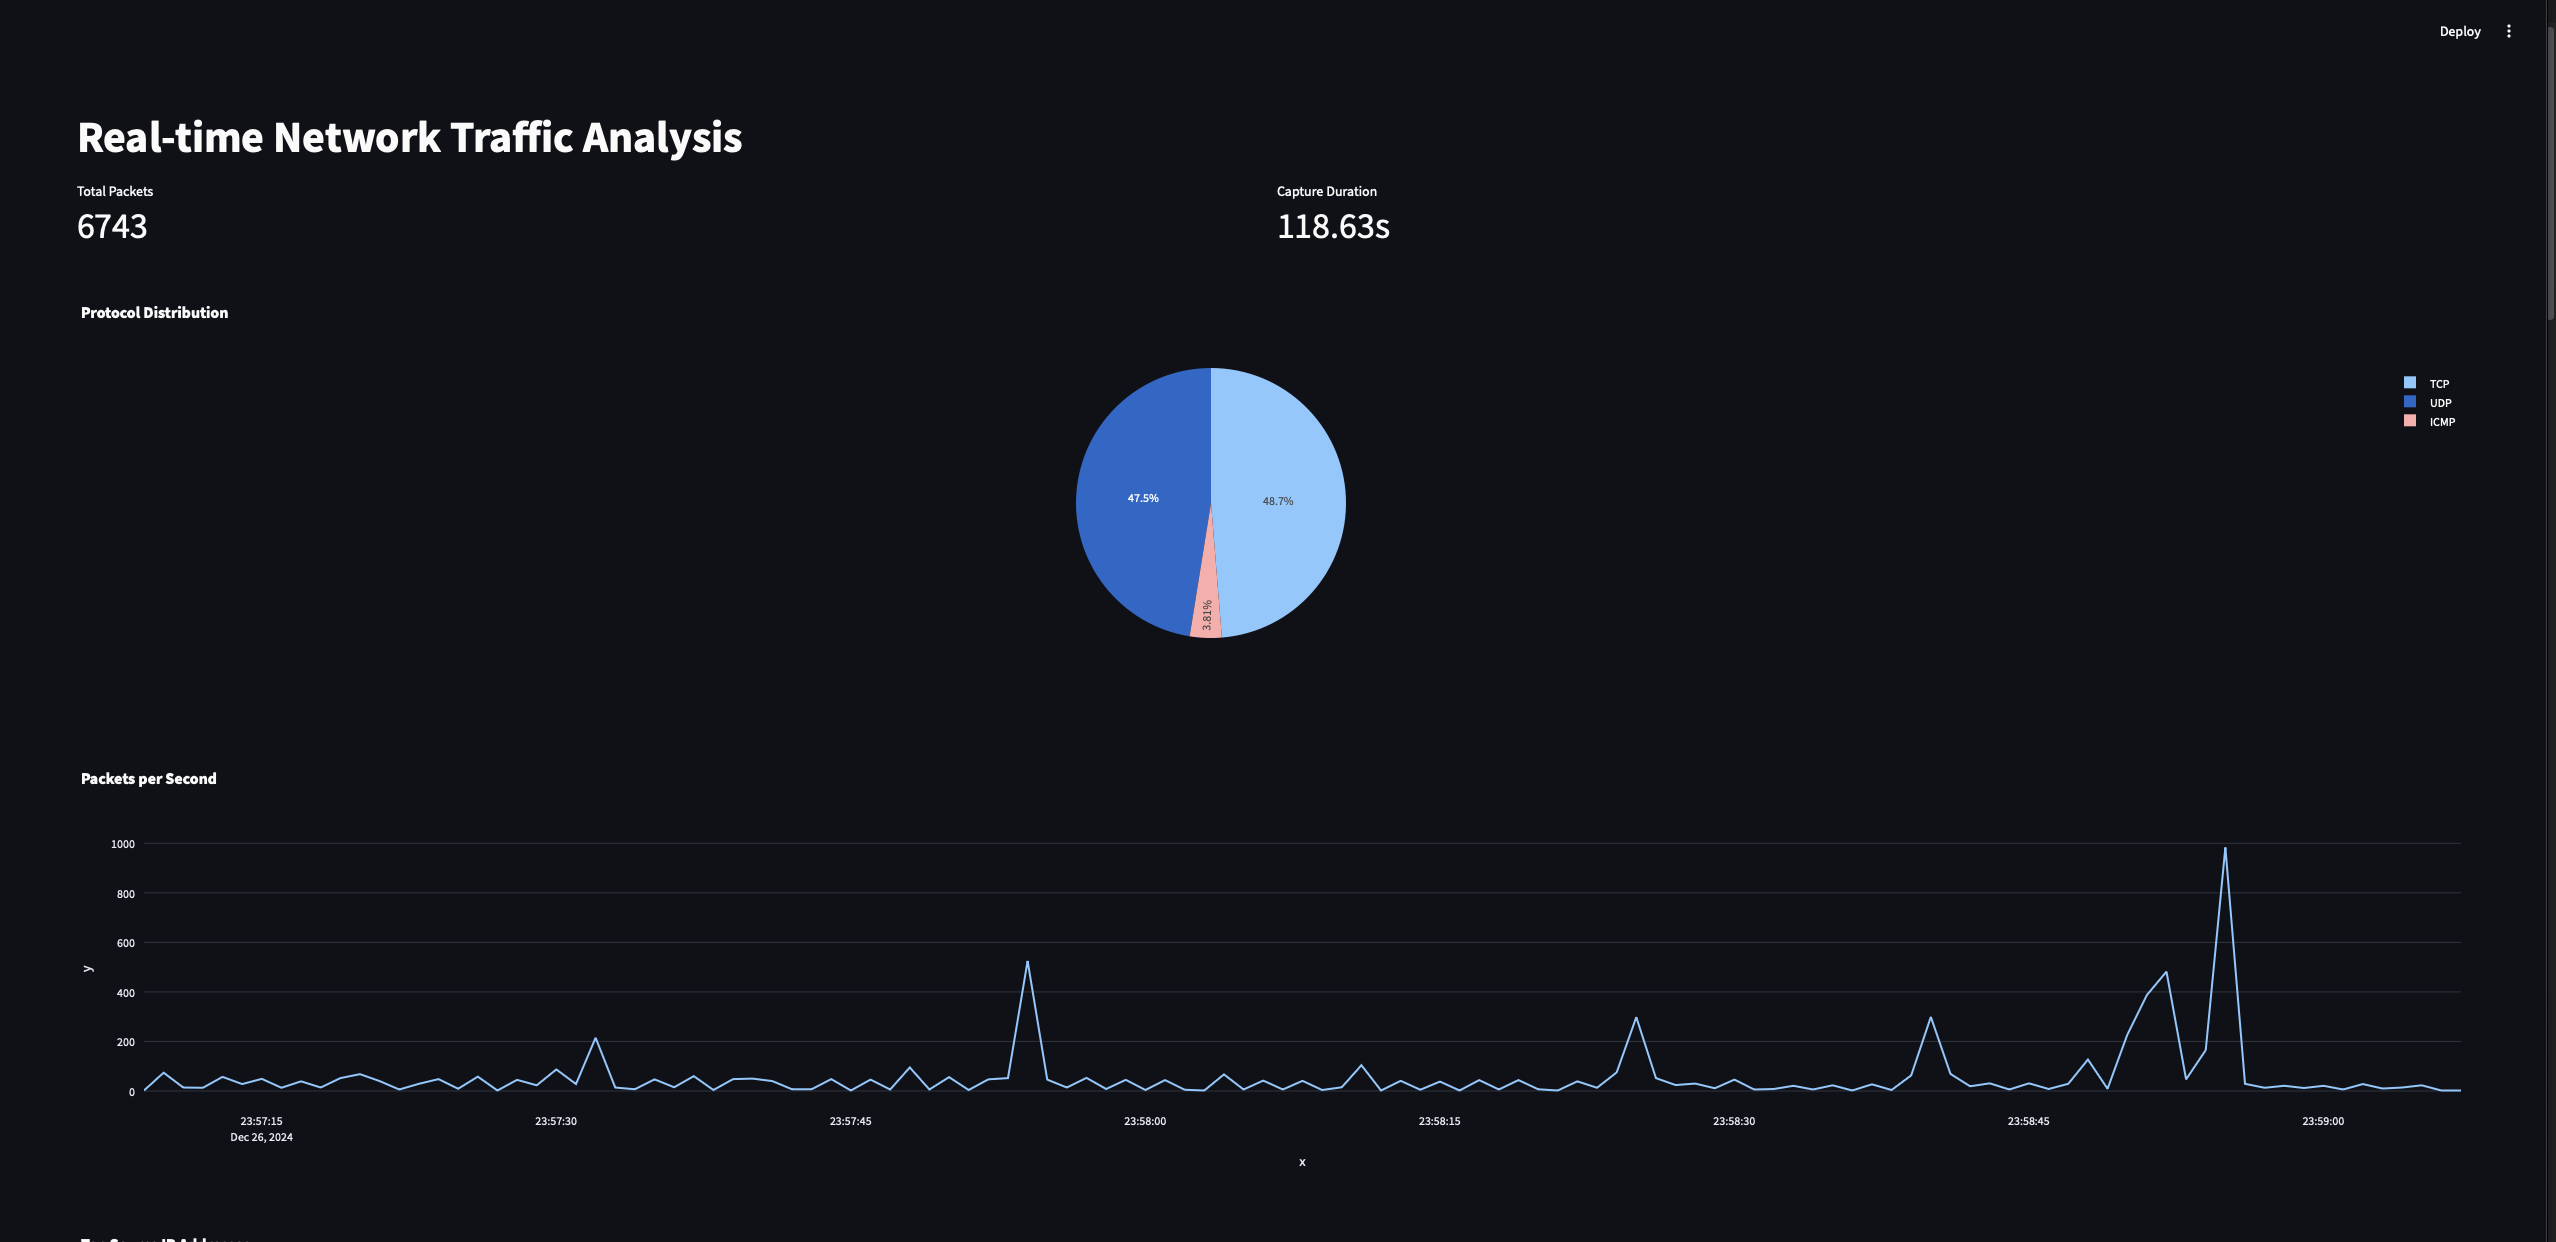
This function will take the data frame as input and will help us plot three charts / graphs:
- Protocol Distribution Chart: This chart will display the proportion of different protocols (for example,TCP, UDP, ICMP) in the captured packet traffic.
- Packets Timeline Chart: This chart will show the number of packets processed per second over a time period.
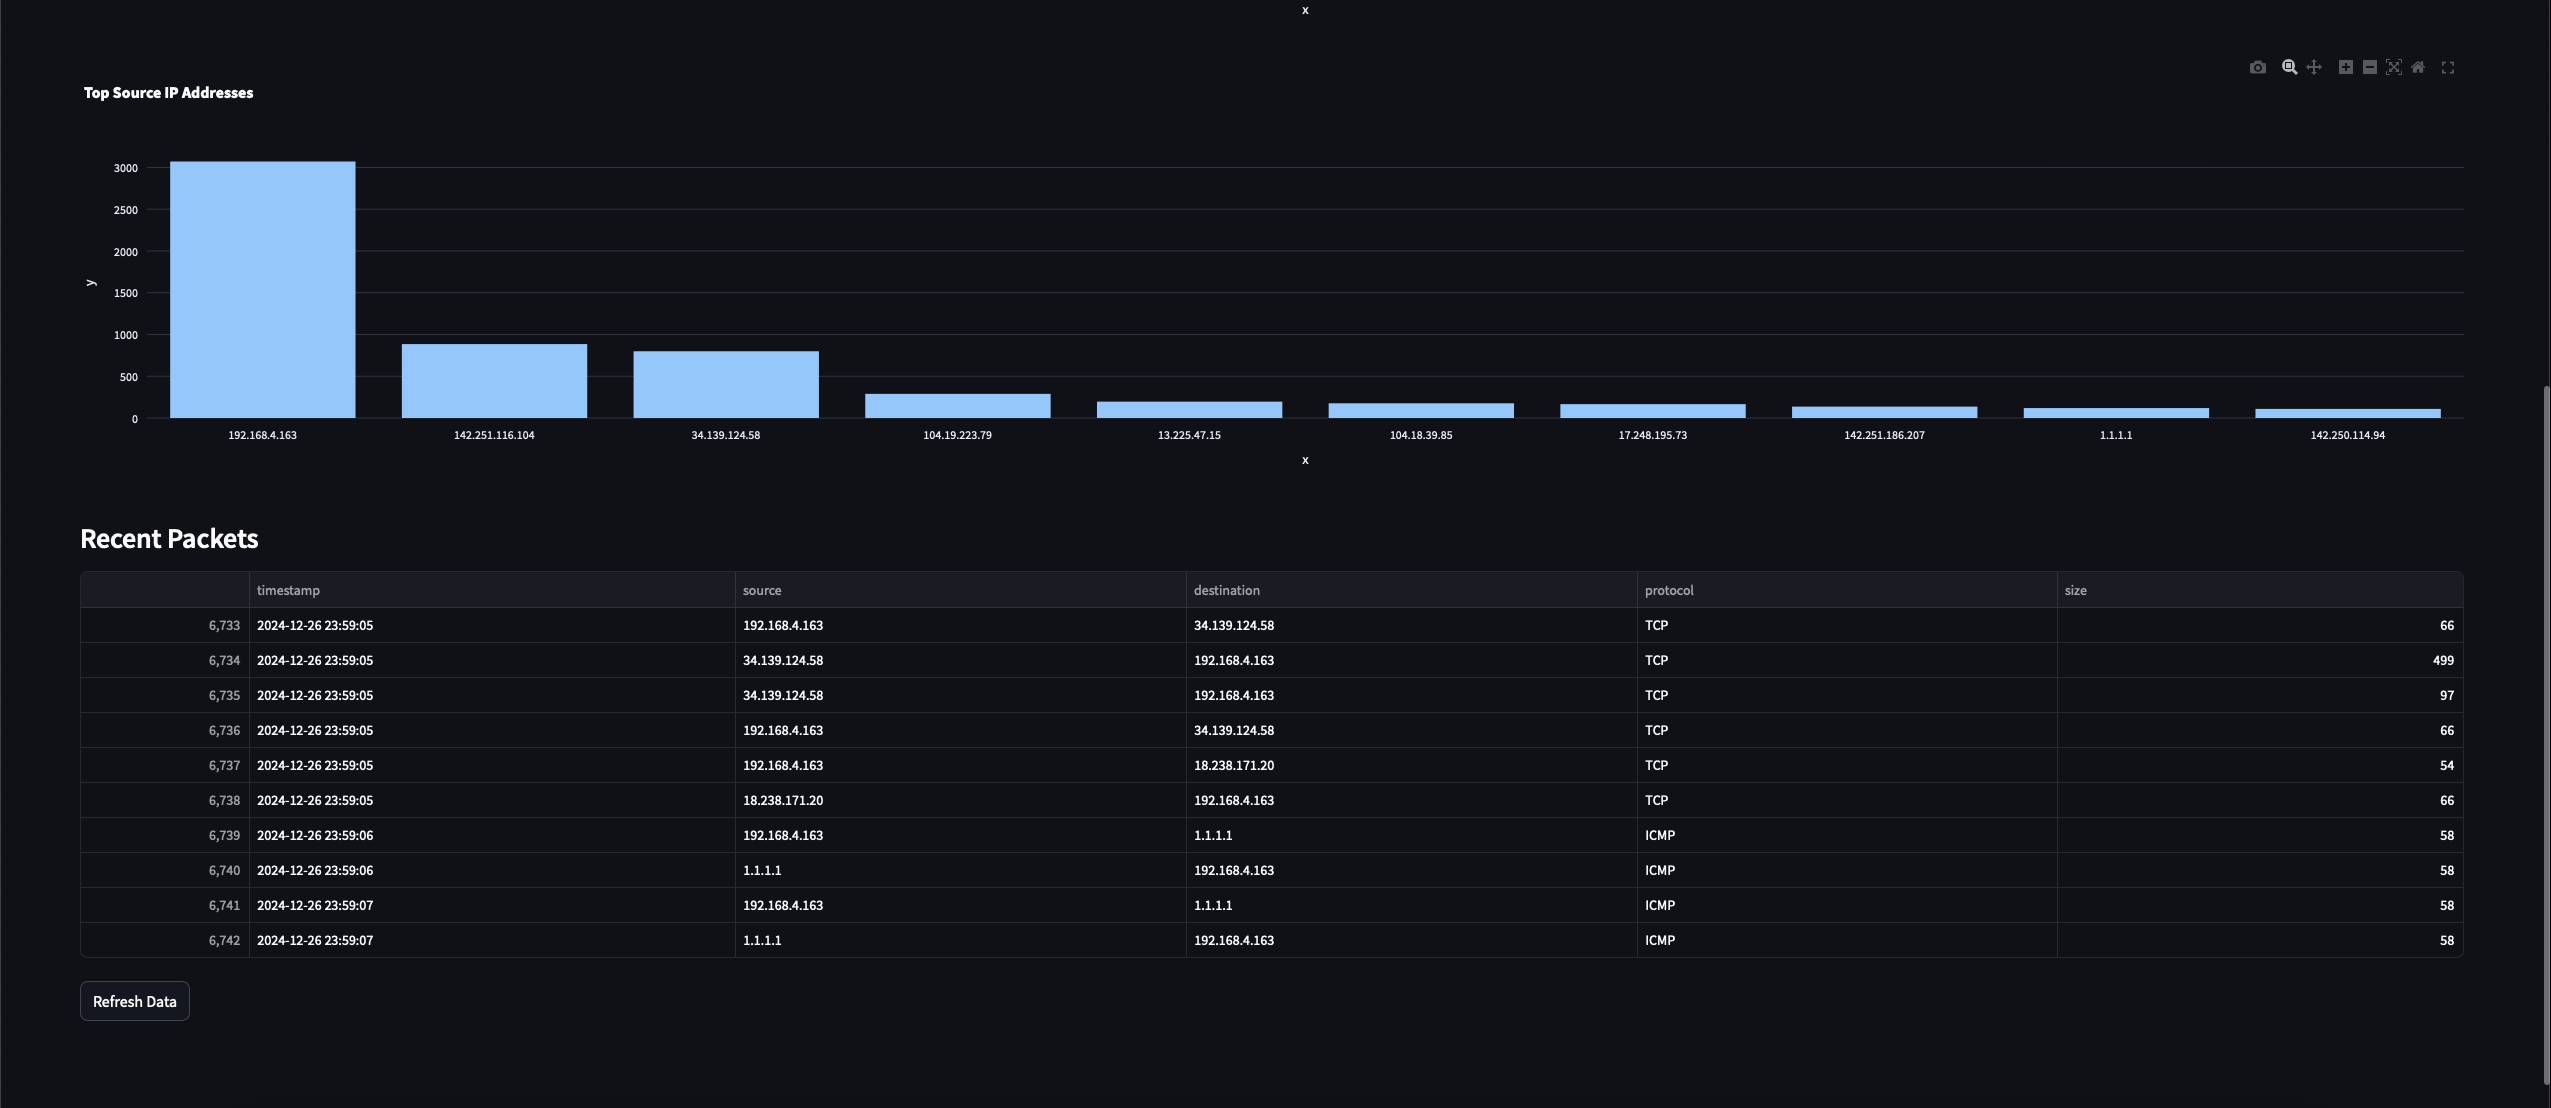
- Top Source IP Addresses Chart: This chart will highlight the top 10 IP addresses that sent the most packets in the captured traffic.
The protocol distribution chart is simply a pie chart of the protocol counts for the three different types (along with OTHER). We use the streamlit and plotly Python tools to plot these charts. Since we also noted the timestamp since the packet capture started, we will use this data to plot the trend of packets captured over time.
For the second chart, we will do a groupby operation on the data and get the number of packets captured in each second (S stands for seconds), and then finally we will plot the graph.
Finally, for the third chart, we will count the distinct source IPs observed and the plot a chart of the IP counts to show the top 10 IPs.
How to Capture the Network Packets
Now, let’s build the functionality to allow us to capture network packet data.
def start_packet_capture():
    """Start packet capture in a separate thread"""
    processor = PacketProcessor()

    def capture_packets():
        sniff(prn=processor.process_packet, store=False)

    capture_thread = threading.Thread(target=capture_packets, daemon=True)
    capture_thread.start()

    return processor
This is a simple function that instantiates the PacketProcessor class and then uses the sniff function in the scapy module to start capturing the packets.
We use threading here to allow us to capture packets independently from the main program flow. This ensures that the packet capturing operation does not block other operations like updating the dashboard in real-time. We also return the created PacketProcessor instance so that it can be used in our main program.
Putting Everything Together
Now let’s stitch all these pieces together with our main function that will act as the driver function for our program.
def main():
    """Main function to run the dashboard"""
    st.set_page_config(page_title="Network Traffic Analysis", layout="wide")
    st.title("Real-time Network Traffic Analysis")

    # Initialize packet processor in session state
    if 'processor' not in st.session_state:
        st.session_state.processor = start_packet_capture()
        st.session_state.start_time = time.time()

    # Create dashboard layout
    col1, col2 = st.columns(2)

    # Get current data
    df = st.session_state.processor.get_dataframe()

    # Display metrics
    with col1:
        st.metric("Total Packets", len(df))
    with col2:
        duration = time.time() - st.session_state.start_time
        st.metric("Capture Duration", f"{duration:.2f}s")

    # Display visualizations
    create_visualizations(df)

    # Display recent packets
    st.subheader("Recent Packets")
    if len(df) > 0:
        st.dataframe(
            df.tail(10)[['timestamp', 'source', 'destination', 'protocol', 'size']],
            use_container_width=True
        )

    # Add refresh button
    if st.button('Refresh Data'):
        st.rerun()

    # Auto refresh
    time.sleep(2)
    st.rerun()
This function will also instantiate the streamlit dashboard, and integrate all of our components together. We first set the page title of our streamlit dashboard and then initialize our PacketProcessor. We use the session state in streamlit to ensure that only one instance of packet capturing is created and the state of it is retained.
Now, we will dynamically get the dataframe from the session state every time the data is processed and begin to display the metrics and the visualizations. We will also display the recently captured packets along with information like the timestamp, source and destination IPs, protocol, and size of the packet. We will also add the ability for the user to manually refresh the data from the dashboard while we also automatically refresh it every two seconds.
Let’s finally run the program with the following command:
sudo streamlit run dashboard.py
Note that you will have to run the program with sudo since the packet capturing capabilities require administrative privileges. If you are on Windows, open your terminal as Administrator and then run the program without the sudo prefix.
Give it a moment for the program to start capturing packets. If everything goes right, you should see something like this:


These are all the visualizations that we just implemented in our streamlit dashboard program.
Future Enhancements
With that, here are some future enhancement ideas that you can use to extend the functionalities of the dashboard:
- Add machine learning capabilities for anomaly detection
- Implement geographical IP mapping
- Create custom alerts based on traffic analysis patterns
- Add packet payload analysis options
Conclusion
Congratulations! You have now successfully built a real-time network traffic analysis dashboard with Python and streamlit. This program will provide valuable insights into network behavior and can be extended for various use cases, from security monitoring to network optimization.
With that, I hope you learnt some basics about network traffic analysis as well as a bit of Python programming. Thanks for reading!