
Get Started With Dash in Python
Get Started With Dash in Python 관련
In this tutorial, you’ll go through the end-to-end process of building a dashboard using Dash. If you follow along with the examples, then you’ll go from a bare-bones dashboard on your local machine to a styled dashboard deployed on PythonAnywhere.
To build the dashboard, you’ll use a dataset of sales and prices of avocados in the United States between 2015 and 2018. Justin Kiggins compiled this dataset using data from the Hass Avocado Board.
How to Set Up Your Local Environment
To develop your app, you’ll need a new directory to store your code and data. You’ll also need a clean Python virtual environment. To create those, execute the commands below, choosing the version that matches your operating system:
mkdir avocado_analytics
cd avocado_analytics
python -m venv venv
venv\Scripts\activate
mkdir avocado_analytics
cd avocado_analytics
python -m venv venv
source venv/bin/activate
The first two commands create a directory for your project and move your current location there. The next command creates a virtual environment in that location. The last command activates the virtual environment.
Next, you need to install the required libraries. You can do that using pip inside your virtual environment. Install the libraries as follows:
python -m pip install dash==2.8.1 pandas==1.5.3
This command will install Dash and pandas in your virtual environment. You’ll use specific versions of these packages to make sure that you have the same environment as the one used throughout this tutorial. Alongside Dash, pandas will help you handle reading and wrangling the data that you’ll use in your app.
Note
Version 2 of Dash was released (plotly/dash) in the fall of 2021. The new version is mostly backward compatible, but some idioms and recommendations have changed.
Finally, you need some data to feed into your dashboard. You can download the data as well as the code you see throughout this tutorial by clicking the link below:
Save the data as avocado.csv in the root directory of the project. By now, you should have a virtual environment with the required libraries and the data in the root folder of your project. Your project’s structure should look like this:
avocado_analytics/
|
├── venv/
|
└── avocado.csv
You’re good to go! Next, you’ll build your first Dash application.
How to Build a Dash Application
For development purposes, it’s useful to think of the process of building a Dash application in three steps:
- Define the content of your application using the app’s layout.
- Style the looks of your app with CSS or styled components.
- Use callbacks to determine which parts of your app are interactive and what they react to.
In this section, you’ll learn about the layout. Next, you’ll learn about style, and in a later section, you’ll learn how to make your dashboard interactive. You’ll start by setting up everything you need to initialize your application, and then you’ll define the layout of your app.
Initializing Your Dash Application
Create an empty file named app.py in the root directory of your project, then review the code of app.py in this section. To make it easier for you to copy the full code, you’ll find the entire contents of app.py at the end of this section.
Here are the first few lines of app.py:
import pandas as pd
from dash import Dash, dcc, html

data = (
    pd.read_csv("avocado.csv")
    .query("type == 'conventional' and region == 'Albany'")
    .assign(Date=lambda data: pd.to_datetime(data["Date"], format="%Y-%m-%d"))
    .sort_values(by="Date")
)

app = Dash(__name__)
On lines 3 and 4, you import the required libraries: pandas and dash. You’ll use pandas to read and organize the data. You’re importing the following elements from dash:
Dashhelps you initialize your application.html, also called Dash HTML Components, lets you access HTML tags.dcc, short for Dash Core Components, allows you to create interactive components like graphs, dropdowns, or date ranges.
On lines 6 to 11, you read the data and preprocess it for use in the dashboard. You filter some of the data because your dashboard isn’t interactive yet, and the plotted values wouldn’t make sense otherwise.
On line 13, you create an instance of the Dash class. If you’ve used Flask before, then initializing a Dash class may look familiar. In Flask, you usually initialize a WSGI application using Flask(__name__). Similarly, for a Dash app, you use Dash(__name__).
Defining the Layout of Your Dash Application
Next, you’ll define the layout property of your application. This property dictates the content of your app. In this case, you’ll use a heading with a description immediately below it, followed by two graphs. Here’s how you define it:
# ...

app.layout = html.Div(
    children=[
        html.H1(children="Avocado Analytics"),
        html.P(
            children=(
                "Analyze the behavior of avocado prices and the number"
                " of avocados sold in the US between 2015 and 2018"
            ),
        ),
        dcc.Graph(
            figure={
                "data": [
                    {
                        "x": data["Date"],
                        "y": data["AveragePrice"],
                        "type": "lines",
                    },
                ],
                "layout": {"title": "Average Price of Avocados"},
            },
        ),
        dcc.Graph(
            figure={
                "data": [
                    {
                        "x": data["Date"],
                        "y": data["Total Volume"],
                        "type": "lines",
                    },
                ],
                "layout": {"title": "Avocados Sold"},
            },
        ),
    ]
)
With this code, you define the .layout property of the app object. This property determines the content of your application using a tree structure made of Dash components.
Dash components come prepackaged in Python libraries. Some of them come with Dash when you install it. You have to install the rest separately. You’ll see two sets of components in almost every app:
- The Dash HTML Components module provides you with Python wrappers for HTML elements. For example, you could use Dash HTML Components to create elements such as paragraphs, headings, or lists.
- The Dash Core Components module provides you with Python abstractions for creating interactive user interfaces. You can use these components to create interactive elements such as graphs, sliders, or dropdowns.
On lines 5 to 13, you can see the Dash HTML components in practice. You start by defining the parent component, html.Div. Then you add two more elements, a heading (html.H1) and a paragraph (html.P), as its children.
These components are equivalent to the <div>, <h1>, and <p> HTML tags. You can use the components’ arguments to modify attributes or the content of the tags. For example, to specify what goes inside the <div> tag, you use the children argument in html.Div.
There are also other arguments in the components, such as style, className, and id, that refer to attributes of the HTML tags. You’ll see how to use some of these properties to style your dashboard in the next section.
The part of the layout shown on lines 5 to 13 will get transformed into the following HTML code:
<div>
  <h1>Avocado Analytics</h1>
  <p>
    Analyze the behavior of avocado prices and the number
    of avocados sold in the US between 2015 and 2018
  </p>
  <!-- Rest of the app -->
</div>
This HTML code is rendered when you open your application in the browser. It follows the same structure as your Python code, with a <div> tag containing an <h1> and a <p> element.
On lines 14 and 26 in the layout code snippet, you can see the graph component from Dash Core Components in practice. There are two dcc.Graph components in app.layout. The first one plots the average prices of avocados during the period of study, and the second plots the number of avocados sold in the United States during the same period.
Under the hood, Dash uses Plotly.js to generate graphs. The dcc.Graph components expect a figure object or a Python dictionary containing the plot’s data and layout. In this case, you provide the latter.
Finally, these two lines of code help you run your application:
# ...

if __name__ == "__main__":
    app.run_server(debug=True)
These lines make it possible to run your Dash application locally using Flask’s built-in server. The debug=True parameter enables the hot-reloading option in your application. This means that when you make a change to your app, it reloads automatically, without you having to restart the server.
You can expand the following box to see the complete source code in one listing:
import pandas as pd
from dash import Dash, dcc, html

data = (
    pd.read_csv("avocado.csv")
    .query("type == 'conventional' and region == 'Albany'")
    .assign(Date=lambda data: pd.to_datetime(data["Date"], format="%Y-%m-%d"))
    .sort_values(by="Date")
)

app = Dash(__name__)

app.layout = html.Div(
    children=[
        html.H1(children="Avocado Analytics"),
        html.P(
            children=(
                "Analyze the behavior of avocado prices and the number"
                " of avocados sold in the US between 2015 and 2018"
            ),
        ),
        dcc.Graph(
            figure={
                "data": [
                    {
                        "x": data["Date"],
                        "y": data["AveragePrice"],
                        "type": "lines",
                    },
                ],
                "layout": {"title": "Average Price of Avocados"},
            },
        ),
        dcc.Graph(
            figure={
                "data": [
                    {
                        "x": data["Date"],
                        "y": data["Total Volume"],
                        "type": "lines",
                    },
                ],
                "layout": {"title": "Avocados Sold"},
            },
        ),
    ]
)

if __name__ == "__main__":
    app.run_server(debug=True)
This is the code for your bare-bones dashboard. It includes all the snippets of code that you reviewed earlier in this section.
Now it’s time to run your application. Open a terminal inside your project’s root directory with the project’s virtual environment activated. Run python app.py, then go to http://localhost:8050 using your preferred browser.
It’s ALIVE! Your dashboard should look like this:
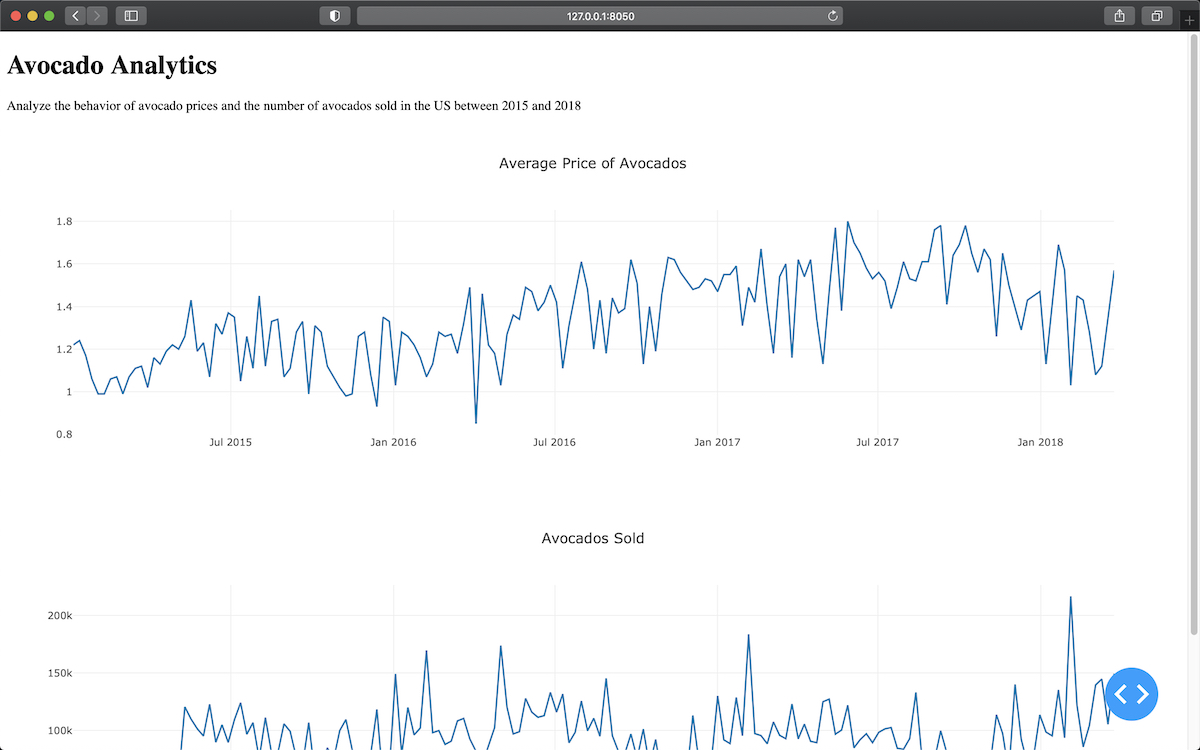
The good news is that you now have a working version of your dashboard. The bad news is that there’s still some work to do before you can show this to others. The dashboard is far from visually pleasing, and you still need to add some interactivity to it.
But don’t worry—you’ll learn how to fix these issues in the next sections.