
How to use Instruments to profile your SwiftUI code and identify slow layouts
How to use Instruments to profile your SwiftUI code and identify slow layouts 관련

Updated for Xcode 15
Xcode’s Instruments tool comes with a fantastic set of analytics for SwiftUI, allowing us to identify how often views were redrawn, how many times calculating the body of a view was slow, and even how our state has changed over time.
First, we need something that is able to provide interesting results we can look at in Instruments. So, this code creates a timer that triggers every 0.01 seconds, and has a body view that shows a random UUID and a button that increases the value it shows every time it’s tapped:
import SwiftUI

class FrequentUpdater: ObservableObject {
    var timer: Timer?

    init() {
        timer = Timer.scheduledTimer(
            withTimeInterval: 0.01,
            repeats: true
        ) { _ in
            self.objectWillChange.send()
        }
    }
}

struct ContentView: View {
    @StateObject private var updater = FrequentUpdater()
    @State private var tapCount = 0

    var body: some View {
        VStack {
            Text("\(UUID().uuidString)")

            Button("Tap count: \(tapCount)") {
                tapCount += 1
            }
        }
    }
}
If you run that code in the simulator you’ll see it’s redrawing constantly because it has values that are always changing.
Note
This is a stress test specifically designed to make SwiftUI do a lot of work in order that Instruments shows us interesting data – you do not want to use the above code in an actual app.
Instrumenting our code
Now press Cmd+I to run the code through Instruments, and choose the SwiftUI instrument. When it appears, press the record button to make it launch the app and start watching it. Now let it run for a few seconds while you click the button ten or so times, then press stop in Instruments – we have enough data to work with.
By default the SwiftUI instrument tells us a variety of things:
- How many views were created during that time and how long it took to create them (“View Body”)
- What the properties of the views were and how they changed over time (“View Properties”)
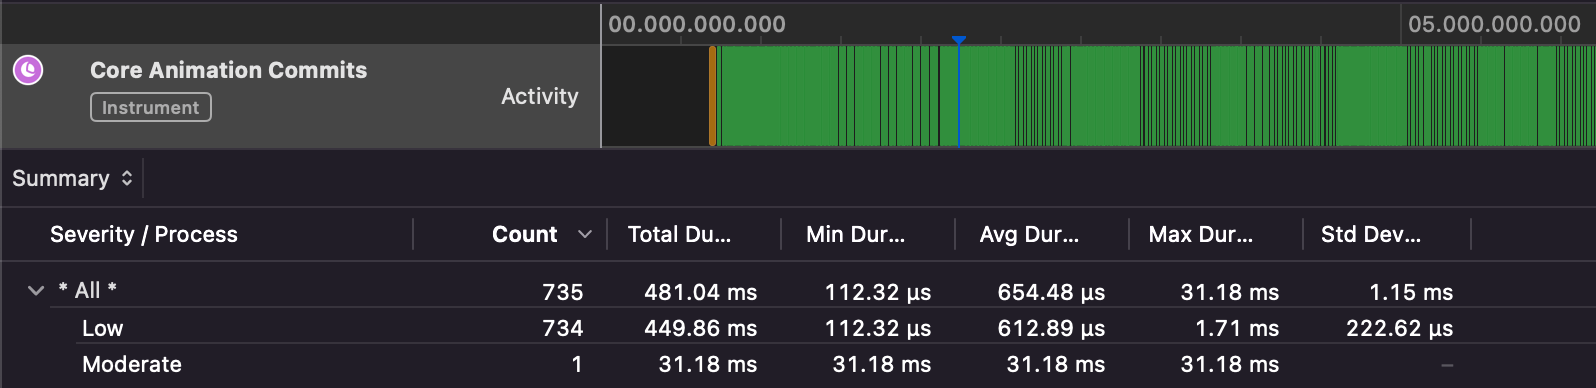
- How many Core Animation commits took place (“Core Animation Commits”)
- Exactly how much time each function call took (“Time Profiler”)
Each of these instruments can help you diagnose and solve performance problems in your SwiftUI applications, so it’s worth taking the time to try them out.
For our little stress test sandbox you will see solid walls of color for View Body, View Properties, and Core Animation Commits, which is an immediate red flag. It tells us that not only is SwiftUI having to recreate our views constantly, but that our properties are changing constantly and as a result Core Animation is having to work overtime to keep up.
Monitoring body invocations
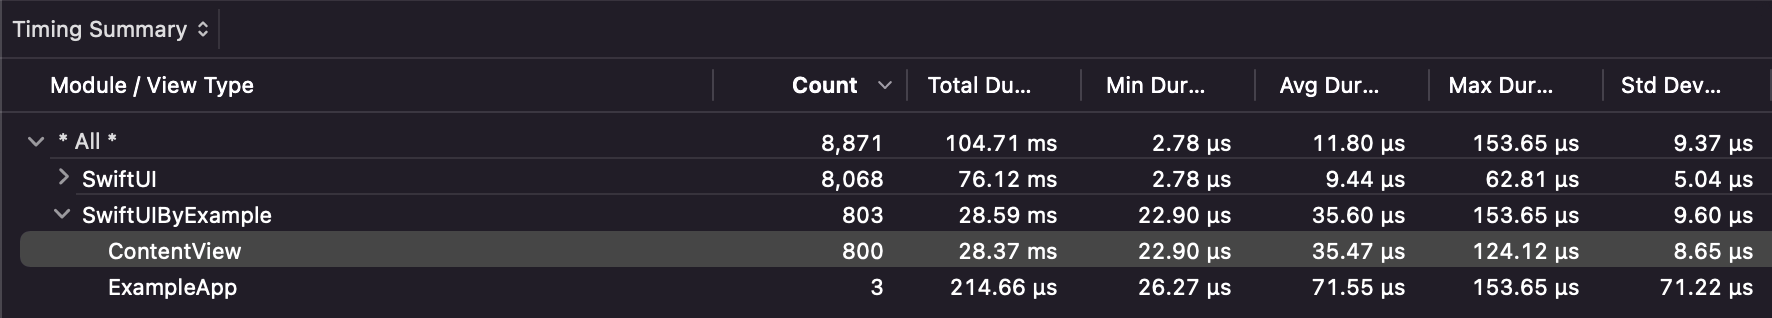
If you select the View Body track – that’s the first row in the list of instruments – you should be able to see that Instruments breaks down the results into SwiftUI and your project, with the former being primitive types like text views and buttons, and the latter containing your custom view types. In our case, that will mean “ContentView” should appear for the custom views, because that’s the name of our view.
Now, what you won’t see here is a perfect one-to-one mapping of your code to SwiftUI views, because SwiftUI aggressively collapses its view hierarchy to do as little work as possible. So, don’t expect to see any VStack creation in the code – that is effectively free for this app.
On this screen, the numbers that matter are Count and Avg Duration – how many times each thing was created, and how long it took. Because this is a stress test you should see very high numbers for Count, but our layout is trivial so the Avg Duration is likely to be a few dozen microseconds.
Tracking state changes
Next, select the View Properties track, which is the second row in the list of instruments. This shows all the properties for all views, including both their current value and all previous values.
Our example app had a button that changed its label when tapped by adding one to a number, and that’s visible right there in this instrument – look for the view type ContentView and the Property Type State<Int>.
Sadly, Instruments isn’t (yet?) able to show us the exact property name there, which might be more confusing if you had several pieces of integer state being tracked. However, it does have a different trick up its sleeve: at the top of the recording window is an arrow marking the current view position, and if you drag that around you’ll see exactly how the application state evolved over time – every time you tapped the button you’ll see that state integer went up by one, and you can wind forward and backward to see it happen.
This unlocks a huge amount of power, because it lets us directly see when state changes caused slow redraws or other work – it’s almost like being in a time machine where you can inspect the exact state of your app at every point during its run.
Identifying slow draws
Although SwiftUI is able to drop down straight to Metal for increased performance, most of the time it prefers to use Core Animation for its rendering. This means we automatically get the built-in Core Animation profiling tools from Instruments, including the ability to detect expensive commits.
Core Animation works best when multiple changes are placed together into a single group, known as a transaction. We effectively stack up a selection of work in one transaction, then ask CA to proceed with rendering the work – known as committing the transaction.
So, when Instruments shows us expensive Core Animation commits, what it’s really showing us is how many times SwiftUI was forced to redraw the pixels on our screen because of updates. In theory this should only happen when the actual state of our app resulted in a different view hierarchy, because SwiftUI should be able to compare the new output of our body property with the previous output.
Looking for slow function calls
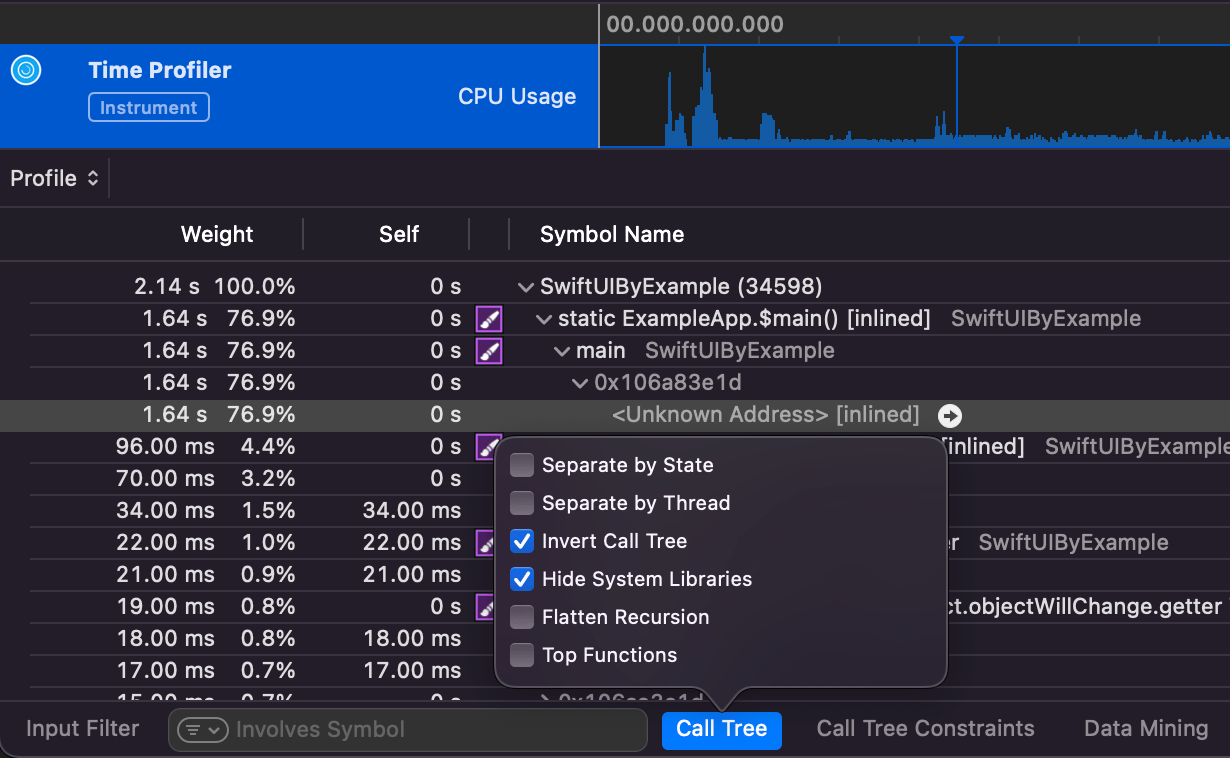
The final important track is the last one, Time Profiler, which shows us exactly how much time was spent in each part of our code. This works identically to the regular time profiler in Instruments, but if you haven’t tried that before here’s the least you need to know:
- The extended detail window on the right shows you the heaviest stack trace by default, which is the piece of code that took longest to run. Bright code (white or black, depending on your macOS color scheme) is code you wrote; dim code (gray) is system library code.
- On the left you can see all the threads that were created, along with disclosure indicators letting you drill down into the functions they called and the functions those functions called, etc. Most of the work will happen inside “start”.
- To avoid clutter you might want to click the Call Tree button at the bottom, then choose Hide System Libraries. This will only show code that you wrote, however if your problem is that you were using the system libraries badly this might not help.
- To get straight to specific details, you can also click Call Tree and choose Invert Call Tree to flip things around so that leaf functions – those at the end of the tree – are shown at the top, and the disclosure indicators now let you drill down (drill up?) to the functions that called them.
Although the time profiler is extremely useful for identifying performance problems, often just looking at the the heaviest stack trace will highlight the biggest problem.
Last tips
Before you charge off to profile your own code, there are a handful of things to be aware of:
- When examining a small part of your app’s performance, you should click and drag over the range in question so that you see only statistics for that part of the app. This lets you focus on performance for specific actions, such as responding to a button press.
- Even though you see solid color bars in Instruments, they only look that way from afar – you can zoom by holding down Cmd and pressing - and + to see more detail
- For the most accurate figures, always profile on a real device.
- If you want to make changes as a result of profiling your code, always make one change at a time. If you make two changes it’s possible one will increase your performance by 20% and the other will decrease it by 10%, but doing them together means you probably think as a whole they increased performance by 10%.
- Instruments runs your code in release mode, which enables all of Swift’s optimizations. This will also affect any debugging flags you’ve added to your code, so be careful.
Similar solutions…
