K-Means Clustering
K-Means Clustering 관련

K-Means clustering is a popular unsupervised learning algorithm used to partition data points into distinct groups based on similarity. In this section, we will dive into the theory behind K-Means clustering and explore its implementation in Python using the scikit-learn library.
In Data Science and Data Analytics, we often want to categorize observations into set of segments or clusters for different purpose. For instance, a company might want to cluster its customers into 3-5 groups based on their transaction history or frequency of purchases. This is usually an Unsupervised Learning approach where the labels (groups/segments/clusters) are unknown.
One of the most popular clustering approaches for clustering observations into groups is the unsupervised clustering algorithm K-Means. Following are conditions for K-Means clustering:
- number of clusters needs to be specified in advance: K
- every observation needs to belong to at least one class
- every observation need to belong to only one class (classes need to be non-overlapping)
- no one observation should belong to more than 1 class
The idea behind K-Means is to minimize the within-cluster variation and maximize the between-cluster variation. So, for K-means to partition the observations into K clusters such that the total within-cluster variation, summed over all K clusters, is as small as possible.
The motivation behind this is to cluster observation so that the observations clustered to same group will be as similar as possible while the observations from different groups are as different as possible.
Mathematically, the within-cluster variation is defined based on the choice of distance measure which you can choose yourself. For instance, as distance measure you can use Euclidean distance, Manhattan distance etc.
K-means clustering is optimal when the within-cluster variation is the smallest. The within-cluster variation of cluster is a measure of the amount by which the observations in a cluster differs from each other. So the following optimization problem should be solved:
Where within-cluster variation using Euclidean distance can be expressed as follows:
The number of observations in the th cluster is denoted by . Thus, the optimization problem for K-means can be described as follows:
\min_{C_{1},\:\dots,\:C_{K}}\left{\sum_{k=1}^{K}\frac{1}{|C_k|} \sum_{i,i'\:\in\:C_{k}} \sum_{j=1}^{p}\:\left(x_{ij}-x_{i'j}\right)^2\right}
K-Means Algorithm
The pseudocode of the K-means Algorithm can be described as follows:
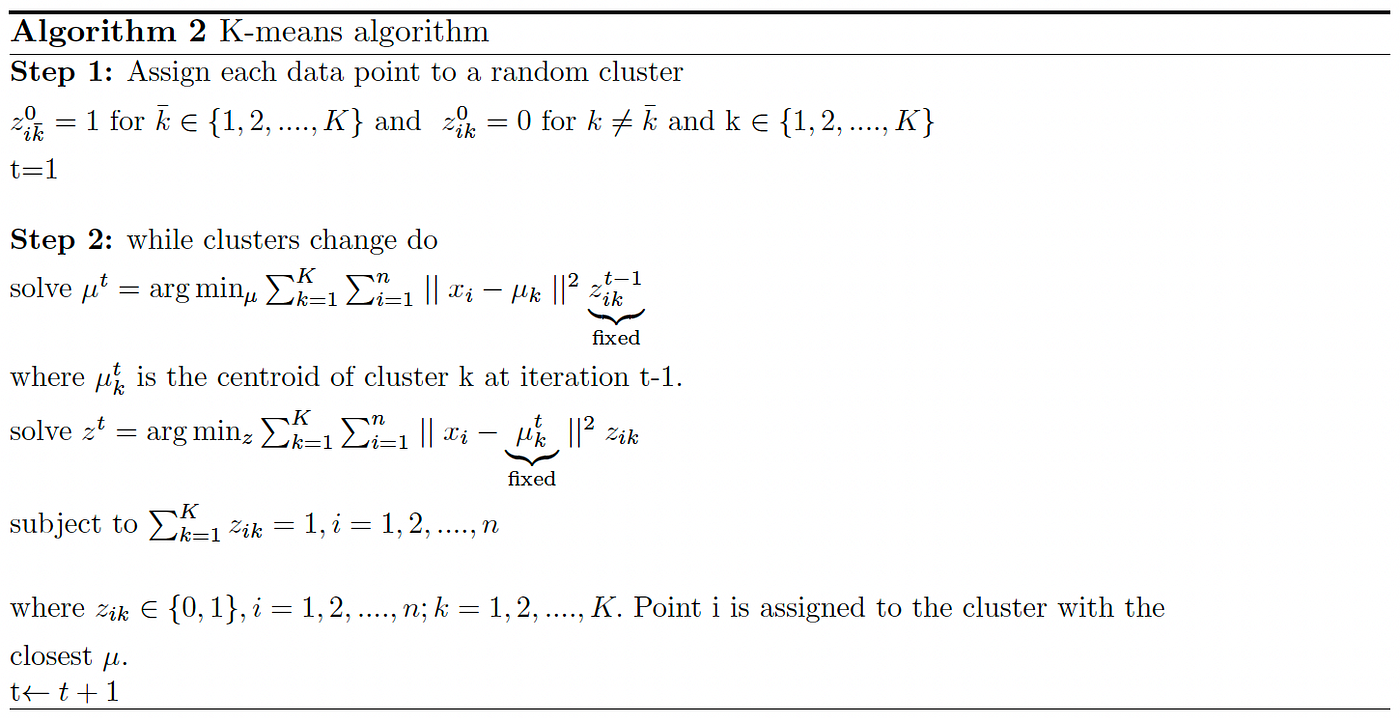
K-Means is a non-deterministic approach and it’s randomness comes in Step 1, where all observations are randomly assigned to 1 of the classes.
In the second step, for each cluster, the cluster centroids are calculating by calculating the mean values of all the data points in the cluster. The centroid of a th cluster is a vector of length containing the means of all variables for the observations in the th cluster, and where is the number of variables.
Then, in the next step, the clusters of observations are updated, such that each observation is assigned to a cluster where the centroid is the closest, by iteratively minimizing the total within sum of squares. That is, we iterate steps 2 and 3 until the cluster centroids are no longer changing or the maximum number of iterations is reached.
K-Means Clustering: Python Implementation
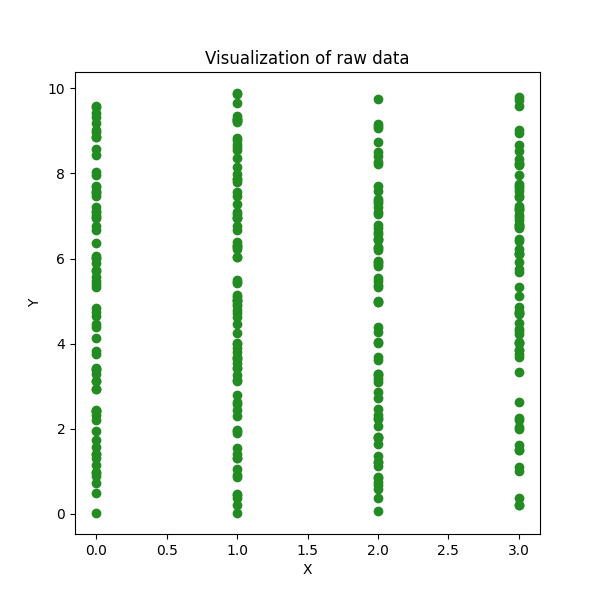
Let’s us look at an example where we aim to classify observations to 4 classes. The raw data looks like this:
# Import necessary libraries
# KMeans is the clustering algorithm from scikit-learn
from sklearn.cluster import KMeans
# Metrics module is used for evaluating clustering performance
from sklearn import metrics
# NumPy is used for numerical computations and array operations
import numpy as np
# Pandas is used for handling data in a structured DataFrame format
import pandas as pd

# Generate synthetic data for K-Means clustering
# Create a 100x2 array with random integers from 0 to 9
df = np.random.randint(0, 10, size=[100, 2])
# Generate a 300x1 array with random integers from 0 to 3
X1 = np.random.randint(0, 4, size=[300, 1])
# Generate a 300x1 array with random floating-point numbers from 0 to 10
X2 = np.random.uniform(0, 10, size=[300, 1])
# Combine X1 and X2 along the second axis to form a dataset with two features
df = np.append(X1, X2, axis=1)

# Apply the K-Means clustering algorithm on the generated dataset
# Call the KMeans_Algorithm function with K=4 clusters
Clustered_df = KMeans_Algorithm(df=df, K=4)
# Convert the clustered data into a Pandas DataFrame
df = pd.DataFrame(Clustered_df)


# Function to perform K-Means clustering
def KMeans_Algorithm(df, K):
    """
    Perform K-Means clustering on the given dataset.

    Parameters:
    df (array-like): Input dataset to be clustered.
    K (int): Number of clusters.

    Returns:
    df (DataFrame): The original dataset with an additional column for cluster labels.
    """

    # Initialize the K-Means model with specified parameters
    # Set the number of clusters to K
    # Use k-means++ initialization to improve convergence
    # Set the maximum number of iterations to 300
    # Set a fixed random seed for reproducibility
    KMeans_model = KMeans(
        n_clusters=K,
        init='k-means++',
        max_iter=300,
        random_state=2021
    )

    # Fit the K-Means model on the dataset
    KMeans_model.fit(df)

    # Extract the cluster centroids (central points of each cluster)
    centroids = KMeans_model.cluster_centers_

    # Convert the centroids into a DataFrame with column names "X" and "Y"
    centroids_df = pd.DataFrame(centroids, columns=["X", "Y"])

    # Obtain cluster labels assigned to each data point
    labels = KMeans_model.labels_

    # Convert the input data into a Pandas DataFrame (if not already)
    df = pd.DataFrame(df)

    # Add a new column to store the assigned cluster labels
    df["labels"] = labels

    # Return the updated DataFrame with cluster labels
    return d

This script is designed to generate synthetic data, apply K-Means clustering, and assign cluster labels to each data point. The K-Means clustering algorithm is an unsupervised machine learning method that groups similar data points into clusters based on their proximity in feature space. Below is a step-by-step breakdown of how the script works.
The first step is importing necessary libraries. The script uses KMeans from sklearn.cluster to implement the K-Means clustering algorithm. The metrics module from sklearn is included, though not used in this script, and can be helpful for evaluating clustering quality. NumPy is used for numerical computations and array operations, while Pandas is used to structure the data into a DataFrame for easier manipulation.
Next, the script generates synthetic numerical data. A NumPy array df is created with dimensions 100x2 containing random integers between 0 and 9. Two additional arrays, X1 and X2, are generated separately. X1 contains 300x1 random integers ranging from 0 to 3, and X2 contains 300x1 random floating-point numbers between 0 and 10. These arrays are then combined along the second axis to form a dataset with two features, making it ready for clustering.
Once the synthetic data is prepared, the script applies the K-Means clustering algorithm. The KMeans_Algorithm function is called with K=4, meaning the algorithm will attempt to group the data into four clusters. The function returns the clustered dataset, which is then converted into a Pandas DataFrame.
The KMeans_Algorithm function takes two parameters: the dataset df and the number of clusters K. Inside this function, the K-Means model is initialized using KMeans(). The number of clusters is set to K, and the init='k-means++' parameter ensures better initialization for faster convergence. The max_iter=300 argument sets a limit on the number of iterations, preventing excessive computation time. The random_state=2021 ensures that results are reproducible.
After initialization, the K-Means model is fitted to the dataset using KMeans_model.fit(df). This step processes the dataset, identifying cluster centers and grouping data points accordingly. Once training is complete, the cluster centroids are extracted using KMeans_model.cluster_centers_, and these are stored in a Pandas DataFrame with column names "X" and "Y" for easier interpretation.
Each data point is assigned a cluster label, which can be retrieved using KMeans_model.labels_. The script then ensures that the dataset is stored as a Pandas DataFrame, if not already formatted as one, and a new column "labels" is added to store the assigned cluster labels. Finally, the updated dataset, now containing the original features along with the cluster assignments, is returned.
The output of this script is a Pandas DataFrame containing three columns: two numerical feature columns representing the generated data points and one "labels" column that indicates the cluster assignment for each data point. For example, a simplified view of the output might show a row where a point with values [2.0, 7.4] is assigned to cluster 0, while another with [1.0, 3.2] belongs to cluster 1.
This script successfully creates a structured dataset, clusters the data into four distinct groups, and assigns meaningful cluster labels to each point. The results can be further analyzed through visualization techniques such as scatter plots to understand the clustering distribution. Future improvements might include using metrics like the Silhouette Score to evaluate clustering quality or experimenting with different numbers of clusters to find the most optimal grouping.
K-Means Clustering: Visualization
One of the key advantages of K-Means is its simplicity and efficiency in handling large datasets. It is a widely used clustering algorithm in various domains, including customer segmentation, image compression, anomaly detection, and pattern recognition.
Despite its simplicity, K-Means is highly effective in discovering inherent group structures within data, making it an essential tool in unsupervised learning. But like any algorithm, it has its limitations—such as sensitivity to the initial choice of centroids and difficulty in detecting non-spherical clusters. Understanding these strengths and weaknesses will help in making informed decisions when applying K-Means to real-world datasets.
In this section, we will explore how to implement K-Means clustering in Python and visualize the results. Through step-by-step code implementation, you will see how data points are grouped into clusters and how the algorithm iteratively refines its cluster assignments. We will also discuss best practices for selecting the optimal number of clusters and how to evaluate the clustering quality.
Understanding the K-Means Algorithm
Before we dive into the implementation, let’s briefly understand how the K-Means algorithm works. The algorithm follows these steps:
- Step 1: Initialization - Randomly select K centroids, where K represents the desired number of clusters.
- Step 2: Assignment - Assign each data point to the nearest centroid based on the Euclidean distance.
- Step 3: Update - Recalculate the centroids by taking the mean of all data points assigned to each cluster.
- Step 4: Repeat - Repeat steps 2 and 3 until convergence criteria are met (e.g., minimal centroid movement).
fig, ax = plt.subplots(figsize=(6, 6))

# for observations with each type of labels from column 1 and 2
plt.scatter(df[df["labels"] == 0][0], df[df["labels"] == 0][1],
c='black', label='cluster 1')
plt.scatter(df[df["labels"] == 1][0], df[df["labels"] == 1][1],
c='green', label='cluster 2')
plt.scatter(df[df["labels"] == 2][0], df[df["labels"] == 2][1],
c='red', label='cluster 3')
plt.scatter(df[df["labels"] == 3][0], df[df["labels"] == 3][1],
c='y', label='cluster 4')
plt.scatter(centroids[:, 0], centroids[:, 1], marker='*', s=300, c='black', label='centroid')
plt.legend()
plt.xlim([-2, 6])
plt.ylim([0, 10])
plt.xlabel('X')
plt.ylabel('Y')
plt.title('Visualization of clustered data')
ax.set_aspect('equal')
plt.show()

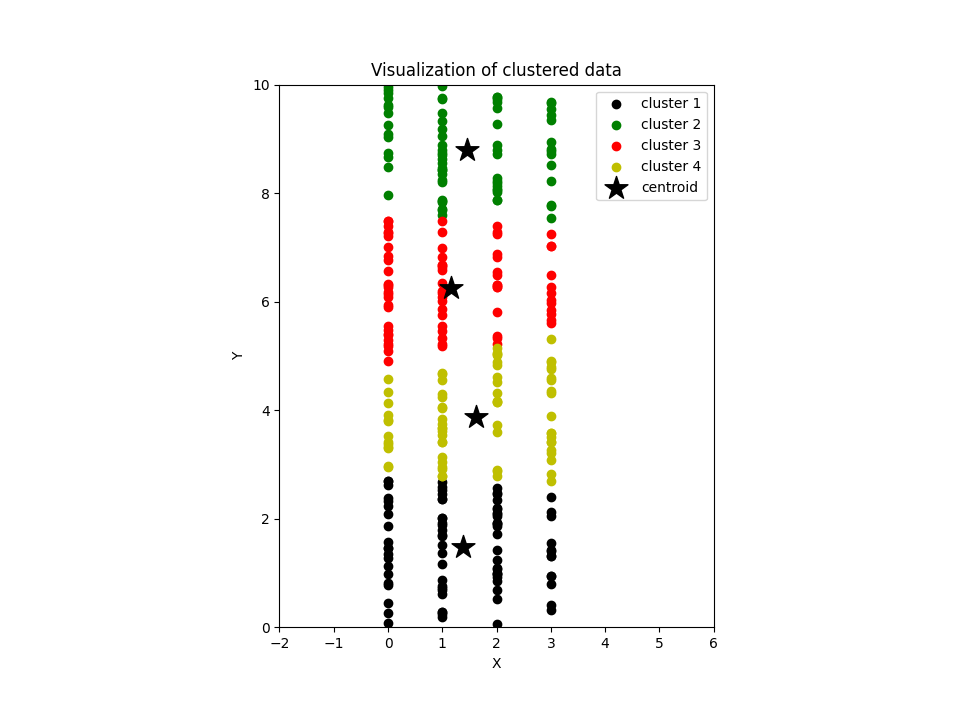
In the figure above, K-means has clustered these observations into 4 groups. And as you can see from the visualisation, the way observations have been clustered even by the graph seems natural and it makes sense.
Elbow Method for Optimal Number of Clusters (K)
One of the biggest challenges in using K-means is the choice of clusters. Sometimes this is a business decision, but most of the time we want to pick a K that is optimal and makes sense. One of the most popular methods to determine this optimal value of K, or number of clusters, is the Elbow Method.
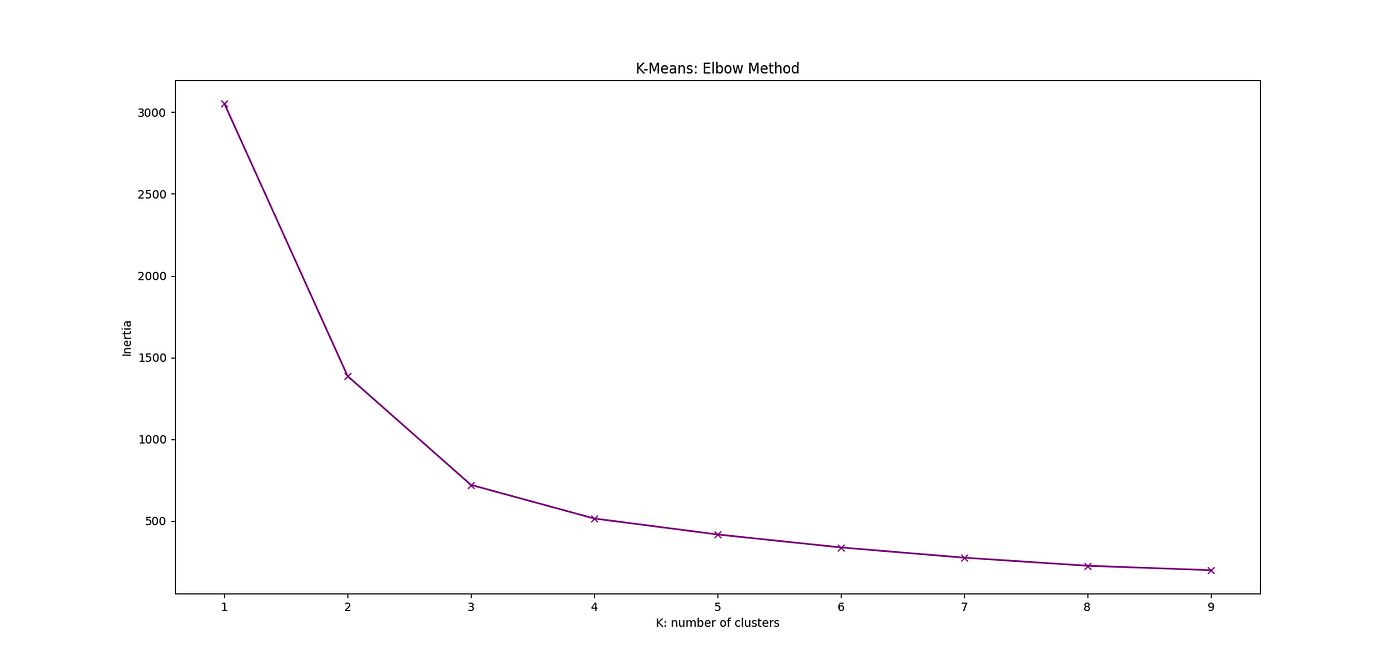
To use this approach, you need to know what Inertia is. Inertia is the sum of squared distances of samples to their closest cluster center. So, the Inertia or within cluster of sum of squares value gives an indication of how coherent the different clusters are or how pure they are. Inertia can be described as follows:
where N is the number of samples within the data set, is the centre of a cluster, and k is the cluster index. So, the Inertia simply computes the squared distance of each sample in a cluster to its cluster centre and sums them up.
Then we can calculate the inertia for different number of clusters . We can plot this as in the following figure where we consider . Then from thee graph we can select the K corresponding to the Inertia where the elbow occurs. In this case, K = 3 where the Elbow happens.
def Elbow_Method(df):
    inertia = []
    # considering K = 1,2,...,10 as K
    K = range(1, 10)
    for k in K:
        KMeans_Model = KMeans(n_clusters=k, random_state = 2022)
        KMeans_Model.fit(df)
        inertia.append(KMeans_Model.inertia_)
    return(inertia)

K = range(1, 10)
inertia = Elbow_Method(df)
plt.figure(figsize = (17,8))
plt.plot(K, inertia, 'bx-')
plt.xlabel("K: number of clusters")
plt.ylabel("Inertia")
plt.title("K-Means: Elbow Method")
plt.show()

K-Means is a non-deterministic approach and it’s randomness comes in Step 1, where all observations are randomly assigned to 1 of the classes.
So as you can see, K-Means clustering offers an efficient and effective approach to grouping data points based on similarity. By implementing the K-Means algorithm in Python, you can easily apply this technique to your own datasets and gain valuable insights into your data.
Python provides powerful tools for implementing and visualizing K-Means clustering. With the scikit-learn library and matplotlib, you can easily apply K-Means to your datasets and learn a lot from the resulting clusters.