Day 97
Day 97 관련

Project 30, part one
Today you’ll be starting a technique project that is entirely unlike everything we’ve done so far. You see, rather than you coding along with me as we build an app from scratch, I’ve already written an app for you.
Sounds good, right? Well, hold up: while this app is vaguely useful, it has some really deep problems. If you try running it on a real device you’ll find it’s extremely slow and likely to crash. If you run in the simulator it will be much less likely to crash, but it will still be equally slow.
In this chapter we’ll be looking at how Xcode, the Simulator, and a dedicated tool called Instruments can help us find and fix performance issues in code. While it’s unlikely you’ll ever see a project that has all of these problems, you will definitely hit them all at some point.
These problems don’t occur because folks are lazy or ignorant. In fact, as Edsger Dijkstra once said, “if debugging is the process of removing software bugs, then programming must be the process of putting them in.” In short, problems are a normal part of the process, so it’s time for you to learn the skills necessary to find and fix them.
Today you have five topics to work through, and you’ll learn about using the Time Profiler and Allocations instruments, how to draw shadows in both Core Graphics and CALayer, re-using table view cells in code, and more.
Setting up
Setting up
This technique project is different to all the others so far. You see, I've already written all the code for you and I'm giving you a working app. Sure it has a few bugs here and there, but it's not too bad. Well, OK: perhaps it's full of bugs, and perhaps this whole project is about showing you how to find and fix those bugs!
We're going to be using a tool called Instruments. It ships as part of Xcode, and is responsible for profiling your app. "Profiling" is the term used when we monitor performance, memory usage and other information of an app, with the aim of improving efficiency.
I'm not going to make you a master of Instruments, but I can at least show you how it helps you find problems with your code. Plus, along the way you'll learn a few extra bits about how iOS works, including shadows, image caching, cell reuse and more.
You should download the source code for this project from twostraws/HackingWithSwift then modify it as we go. When you open the project, go ahead and run the project either on a real device or using the simulator. The real device will always be more trustworthy in terms of performance, but some options are only available in the simulator.
What are we working with?
What are we working with?
This is a really simple app, albeit quite a broken one. Obviously the breakages are deliberate, but they are all things I have seen in real, shipping code. The app shows a table view containing garish images of popular internet acronyms.
When one of the rows is tapped, a detail view controller appears, showing the image at full size. Every time you tap on the big image, it adds one to a count of how many times that image was tapped, and that count is shown in the original view controller.
That’s it – that's all the app does. I haven't even used a storyboard, because I want all the problems to be visible (and fixable!) in Swift code.
And how bad are the problems? Well, if you run the app on a device, you'll probably find that it crashes after you’ve viewed several pictures – on my iPhone I get about two-thirds of the way through before it gives up.
You might also notice that scrolling isn’t smooth in the table view, particularly on older devices. If you scroll around a few times iOS might be able to smooth the scrolling a little, but you’ll certainly struggle to get it a flawless 60 frames per second on iPhone, or 120 frames per second on iPad Pro – the gold standard for iOS drawing.
I hope you’ve never seen an app that manages to have all these problems at the same time, but I can guarantee you’ve seen apps that have one or two at a time. The goal of this project is to help you learn the skills needed to identify, fix, and test solutions to these common problems, so let’s dive in now…
What can Instruments tell us?
What can Instruments tell us?
Press Cmd+I to run your app using Instruments, and after a few seconds a window will appear offering you a variety of profiling templates. Please select Time Profiler then click Choose. When the new window appears, click the red circle in the top-left corner to start recording of the app.
Your app will launch on your device (or in the simulator) and Instruments will begin monitoring its usage in realtime. You'll see a spike in Instruments' readings to begin with, which reflects the huge amount of work any app does just to start up. We don't care about that for now, we're more interested in the workload of the app once it's running.
So, scroll around a bit, tap an image, go back, scroll around some more, tap another image, and so on. Aim to get about at least 20 seconds or so of real app usage, then press the Stop button, which is where the record button was earlier.
The top half of your Instruments window will show readings from your app; the bottom half is showing details on those readings. By default, the detail view shows everything in the app run that was captured, but I want you to click and drag in the top window to select part of the readings when you tapped on an image. All being well (or as well as can be expected in this broken code!) you should see the readings noticeably spike at those places.
When you select an area of the readings like this, the detail view now shows information just on the part you chose. You should see that the vast majority of the time that was selected was spent on the main thread, which means we're not taking much advantage of having multiple CPU cores.
Immediately to the left of "Main thread" in the detail view is a disclosure arrow. You can click that to open up all the top-level calls made on the Main Thread, which will just be "Start", which in turn has its own calls under its own arrow. You can if you want hold down Option and click on these arrows, which causes all the children (and their children's children) to be opened up, but that gets messy.
Instead, there are two options. First, you should have a right-hand detail pane with two buttons: [Extended Detail] and [Run Info] (accessible through Cmd+1 and Cmd+2). Select "[Main thread]" in the detail view then press Cmd+1 to choose the extended detail view: this will automatically show you the "heaviest" stack trace, which is the code that took the most time to run.
In the picture below you can see the bottom half of Instruments after running a time profile. The pane on the right is showing the heaviest stack trace, and on the left you can see all the threads that were executing as well as what they were doing.
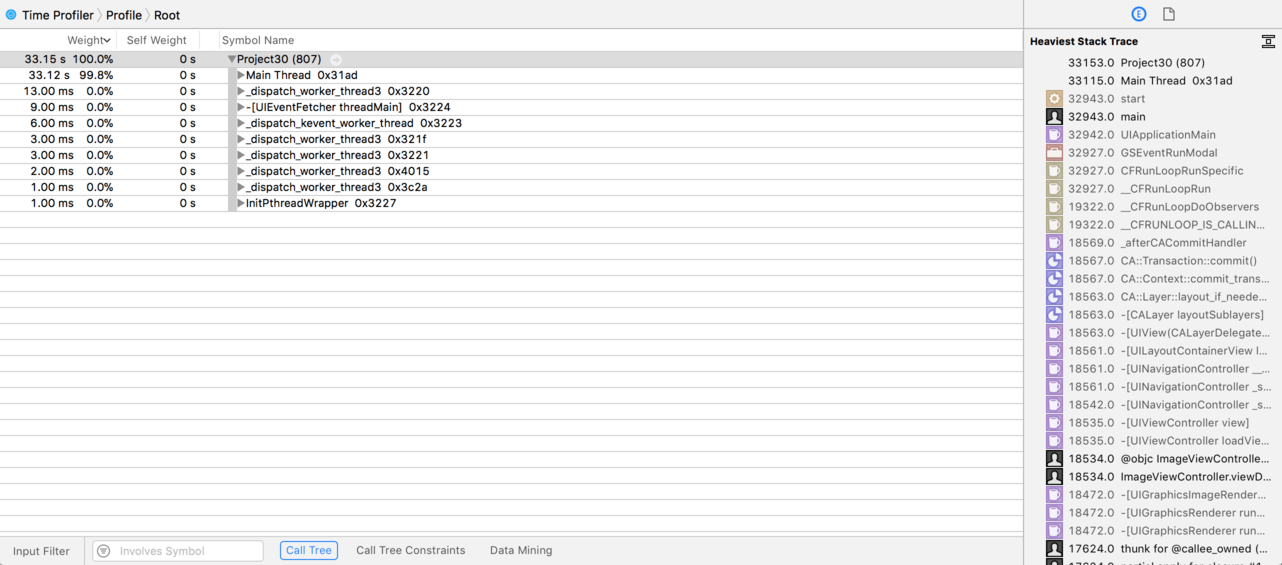
If you scroll down to the bottom, you'll see it's probably all around either in the table view’s cellForRowAt or the detail view’s viewDidLoad() depending on whether you spent more of your time flicking through the table view or going into the detail controller.
This heaviest stack trace is the part of your code that took up the most time. That might not always be your problem: sometimes something that runs slowly is just something that's always going to be slow, because it’s doing a lot of work. That said, it's always a good place to start!
The second option is inside the Call Tree menu that inside the status bar at the bottom of the Time Profiler window, and is called Invert Call Tree. This will show you the heaviest code first, with a disclosure arrow revealing what called it, and so on. Chances are you’ll now see lots of image-related functions: argb32_sample_argb32() is called by argb32_image_mark(), which is called by argb32_imag(), and so on.
There is a third option, but it's of mixed help. It's called "Hide system libraries" and is near to the "Invert Call Tree" checkbox. This eliminates all time being used by Apple's frameworks so you can focus on your own code. This is great if you have lots of complicated code that could be slow, but it doesn't help at all if your app is slow because you're using the system libraries poorly!
Now, although profiling your code is best done on a real device, using the simulator gives us some bonus functionality that will help us identify performance problems. So, try running the app in the simulator now.
Under the Debug menu on your Mac you’ll see a few options. Two in particular are very useful:
- Color Blended Layers shows views that are opaque in green and translucent in red. If there are multiple transparent views inside each other, you'll see more and more red.
- Color Offscreen-Rendered shows views that require an extra drawing pass in yellow. Some special drawing work must be drawn individually off screen then drawn again onto the screen, which means a lot more work. Broadly speaking, you want
[Color Blended Layers]to show as little red as possible, and[Color Offscreen-Rendered Yellow]to show no yellow.
Try these options on both the table view and the detail view to see how things look.
Fixing the bugs: slow shadows
Fixing the bugs: slow shadows
It's time for us to start fixing the problems. Important: when making performance changes you should change only one thing at a time, then re-test to make sure your change helped. If you changed two or more things and performance got better, which one worked? Or, if performance got worse, perhaps one thing worked and one didn't!
Let's begin with the table view: you should have seen parts of the table view turn dark yellow when Color Offscreen-Rendered Yellow was selected. This is happening because the images are being rendered inefficiently: the rounded corners effect and the shadow are being done in real-time, which is computationally expensive.
You can find the code for this in SelectionViewController.swift, inside the cellForRowAt method:
let renderer = UIGraphicsImageRenderer(size: original.size)

let rounded = renderer.image { ctx in
    ctx.cgContext.addEllipse(in: CGRect(origin: CGPoint.zero, size: original.size))
    ctx.cgContext.clip()

    original.draw(at: CGPoint.zero)
}

cell.imageView?.image = rounded

// give the images a nice shadow to make them look a bit more dramatic
cell.imageView?.layer.shadowColor = UIColor.black.cgColor
cell.imageView?.layer.shadowOpacity = 1
cell.imageView?.layer.shadowRadius = 10
cell.imageView?.layer.shadowOffset = CGSize.zero
There are two new techniques being demonstrated here: creating a clipping path and rendering layer shadows.
We’ve used UIGraphicsImageRenderer before to create custom-rendered images, and the rendering here is made up of three commands: adding an ellipse and drawing a UIImage are both things you’ve seen before, but the call to clip() is new. As you know, you can create a path and draw it using two separate Core Graphics commands, but instead of running the draw command you can take the existing path and use it for clipping instead. This has the effect of only drawing things that lie inside the path, so when the UIImage is drawn only the parts that lie inside the elliptical clipping path are visible, thus rounding the corners.
The second new technique in this code is rendering layer shadows. iOS lets you add a basic shadow to any of its views, and it's a simple way to make something stand out on the screen. But it's not fast: it literally scans the pixels in the image to figure out what's transparent, then uses that information to draw the shadow correctly.
The combination of these two techniques creates a huge amount of work for iOS: it has to load the initial image, create a new image of the same size, render the first image into the second, the render the second image off-screen to calculate the shadow pixels, then render the whole finished product to the screen. When you hit a performance problem, you either drop the code that triggers the problem or you make it run faster.
In our case, we'll assume the designer insists the drop shadow is gorgeous so we need to make the code faster. There are several different approaches we could take, and I want to walk you through each of them so you can see the relative benefits of each.
The first possibility: Core Graphics is more than able of drawing shadows itself, which means we could handle the shadow rendering in our UIGraphicsImageRenderer pass rather than needing an extra render pass. To do that, we can use the Core Graphics setShadow() method, which takes three parameters: how far to offset the shadow, how much to blur it, and what color to use. You’ll notice there’s no way of specifying what shape the shadow should be, because Core Graphics has a simple but powerful solution: once you enable a shadow, it gets applied to everything you draw until you disable it by specifying a nil color.
So, we can replicate our current shadow like this:
let rounded = renderer.image { ctx in
    ctx.cgContext.setShadow(offset: CGSize.zero, blur: 200, color: UIColor.black.cgColor)
    ctx.cgContext.fillEllipse(in: CGRect(origin: CGPoint.zero, size: original.size))
    ctx.cgContext.setShadow(offset: CGSize.zero, blur: 0, color: nil)

    ctx.cgContext.addEllipse(in: CGRect(origin: CGPoint.zero, size: original.size))
    ctx.cgContext.clip()

    original.draw(at: CGPoint.zero)
}
Notice how the blur is 200 points, which is quite different from the shadow radius of 10 in the old code? The reason for this is important, because it highlights another significant problem in the code. When the original code set the shadow size using cell.imageView?.layer.shadowRadius it was specified in points relative to the size of the UIImageView. When the new code sets the shadow size using setShadow() it’s in points relative to the size of the image being drawn, which is created like this:
let renderer = UIGraphicsImageRenderer(size: original.size)
The problem is that the images being loaded are 750x750 pixels at 1x resolution, so 1500x1500 at 2x and 2250x2250 at 3x. If you look at viewDidLoad() you’ll see that the row height is 90 points, so we’re loading huge pictures into a tiny space. That means loading a 1500x1500 image or larger, creating a second render buffer that size, rendering the image into it, and so on.
Clearly those images don’t need to be anything like that size, but sometimes you don’t have control over it. In this app you might be able to go back to the original designer and ask them to provide smaller assets, or if you were feeling ready for a fight you could resize them yourself, but what if you had fetched these assets from a remote server? And wait until you see the size of the images in the detail view – those images might only take up 500KB on disk, but when they are uncompressed by iOS they’ll need around 45 MB of RAM!
A second thing to notice is that the result of this new shadowing isn’t quite the same, because the shadow being rendered is now properly clipped inside the bounds of its image view. Although it’s more technically correct, it doesn’t look the same, and I’m going to assume that the original look – ugly as it was – was intentional.
So, option 1 – making Core Graphics draw the shadow – helps eliminate the second render pass, but it has very different results and a result we should rule it out. However, it did at least point us to an interesting problem: we’re squeezing very large images into a tiny space. iOS doesn’t know or care that this is happening because it just does what its told, but we have more information: we know the image isn’t needed at that crazy size, so we can use that knowledge to deliver huge performance increases.
First, change the rendering code to this:
let renderRect = CGRect(origin: .zero, size: CGSize(width: 90, height: 90))
let renderer = UIGraphicsImageRenderer(size: renderRect.size)

let rounded = renderer.image { ctx in
    ctx.cgContext.addEllipse(in: renderRect)
    ctx.cgContext.clip()

    original.draw(in: renderRect)
}
That still causes iOS to load and render a large image, but it now gets scaled down to the size it needs to be for actual usage, so it will immediately perform faster.
However, it still incurs a second rendering pass: iOS still needs to trace the resulting image to figure out where the shadow must be drawn. Calculating the shadow is hard, because iOS doesn’t know that we clipped it to be a circle so it needs to figure out what's transparent itself. Again, though, we have more information: the shadow is going to be a perfect circle, so why bother having iOS figure out the shadow for itself?
We can tell iOS not to automatically calculate the shadow path for our images by giving it the exact shadow path to use. The easiest way to do this is to create a new UIBezierPath that describes our image (an ellipse with width 90 and height 90), then convert it to a CGPath because CALayer doesn't understand what UIBezierPath is.
Here's the updated shadow code:
// give the images a nice shadow to make them look a bit more dramatic
cell.imageView?.layer.shadowColor = UIColor.black.cgColor
cell.imageView?.layer.shadowOpacity = 1
cell.imageView?.layer.shadowRadius = 10
cell.imageView?.layer.shadowOffset = CGSize.zero
cell.imageView?.layer.shadowPath = UIBezierPath(ovalIn: renderRect).cgPath
When you run that, you'll still see the same shadows everywhere, but the dark yellow color is gone. This means we’ve successfully eliminated the second render pass by giving iOS the pre-calculated shadow path, and we’ve also sped up drawing by scaling down the amount of working being done. You can turn off Color Offscreen-Rendered Yellow now; we don’t need it any more.
Working with rounded corners and shadows can be tricky, as you’ve seen here. If it weren’t for the shadowing, we could eliminate the first render pass by setting layer.cornerRadius to have iOS round the corners for us – it’s a nice and easy way to create rounded rectangle shapes (or even circles!) without any custom rendering code.
Fixing the bugs: wasted allocations
Fixing the bugs: wasted allocations
Back in Xcode, press Cmd+I to launch a fresh instance of Instruments, and this time I want you to choose the Allocations instrument. This tells you how many objects you're creating and what happens to them. Press record, then scroll around the table view a few times to get a complete picture of the app running. At the very least, you should go all the way down to the bottom and back up two or three times.
What you'll see is a huge collection of information being shown – lots of "malloc", lots of "CFString", lots of "__NSArrayM” and more. Stuff we just don't care about right now, because most of the code we have is user interface work. Fortunately, there's a search box just below the detail pane – it should say "Instrument Detail" but if you type "UI" in there it will only show information that has "UI" somewhere in there, which just happens to be all of Apple's user interface libraries!
In the picture below you can see how filtering for "UI" inside Instruments shows only data that has "UI" in its name somewhere, which primarily restricts the view to things that come from Apple's UIKit libraries.
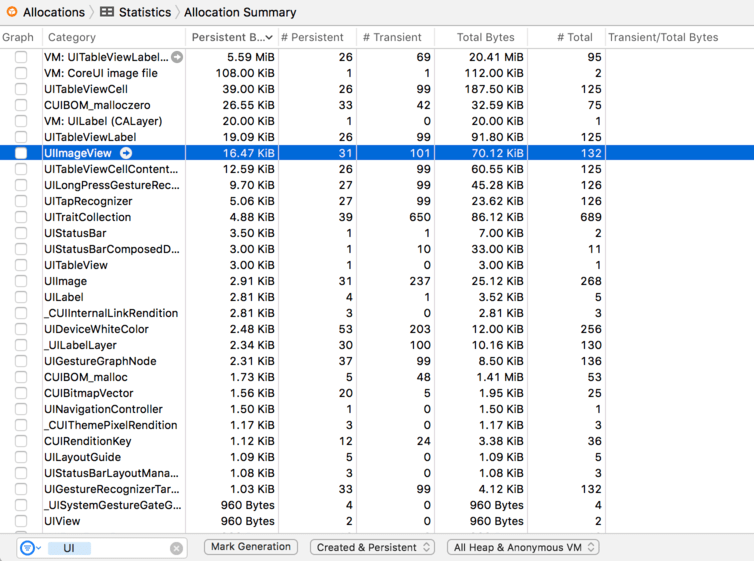
Once you filter by "UI" you'll see see UIImage, UIImageView, UITableViewCell and more. The allocations instrument will tell you how many of these objects are persistent (created and still exist) and how many are transient (created and since destroyed). Notice how just swiping around has created a large number of transient UIImageView and UITableViewCell objects?
This is happening because each time the app needs to show a cell, it creates it then creates all the subviews inside it – namely an image view and a label, plus some hidden views we don’t usually care about. iOS works around this cost by using the method dequeueReusableCell(withIdentifier:), but if you look at the cellForRowAt method you won’t find it there. This means iOS is forced to create a new cell from scratch, rather than re-using an existing cell. This is a common coding mistake to make when you're not using storyboards and prototype cells, and it's guaranteed to put a speed bump in your apps.
If you look inside cellForRowAt method you'll see this line:
let cell = UITableViewCell(style: .default, reuseIdentifier: "Cell")
That's the only place where table view cells are being created, so clearly it's the culprit because it creates a new cell every time the table view asks for one. This has been slow since the very first days of iOS development, and Apple has always had a solution: ask the table view to dequeue a cell, and if you get nil back then create a cell yourself.
This is different from when we were using prototype cells with a storyboard. With storyboards, if you dequeue a prototype cell then iOS automatically handles creating them as needed.
If you're creating table view cells in code, you have two options to fix this intense allocation of views. First, you could rewrite the above line to be this:
var cell: UITableViewCell! = tableView.dequeueReusableCell(withIdentifier: "Cell")

if cell == nil {
    cell = UITableViewCell(style: .default, reuseIdentifier: "Cell")
}
That dequeues a cell, but if it gets nil back then we create one. Note the force unwrapped optional at the end of the first line – we’re saying that cell might initially be empty, but it will definitely have a value by the time it’s used.
The other solution you could use is to register a class with the table view for the reuse identifier "Cell". Using this method you would add this to viewDidLoad():
tableView.register(UITableViewCell.self, forCellReuseIdentifier: "Cell")
And now we can use our usual method dequeuing table view cells inside cellForRowAt:
let cell = tableView.dequeueReusableCell(withIdentifier: "Cell", for: indexPath)
With this approach, you will never get nil when dequeuing a cell with the identifier "Cell". As with prototype cells, if there isn't one to dequeue a new cell will be created automatically.
The second solution is substantially newer than the first and can really help cut down the amount of code you need. But it has two drawbacks: with the first solution you can specify different kinds of cell styles than just .default, not least the .subtitle option we used in project 7; also, with the first solution you explicitly know when a cell has just been created, so it's easy to force any one-off work into the if cell == nil { block.
Regardless of which solution you chose (you'll use both in your production code, I expect), you should be able to run the allocations instrument again and see far fewer table view cell allocations. With this small change, iOS will just reuse cells as they are needed, which makes your code run faster and operate more efficiently.