How to Build a Weather App with R Shiny
How to Build a Weather App with R Shiny 관련

In this tutorial, you’ll learn how to build a weather app in R. Really - a weather app, in R? Wait, hear me out.
When you think of R, you probably imagine someone wearing chunky thick prescription glasses and devouring a book. You know, a statistician dealing with complex models, an insane amount of mathematical equations, and copious amounts of data.
But R is far more than just a tool for statistics. It shines when you need to turn raw data into actionable insights and present those insights in a clear, engaging way.
With frameworks like Shiny, R takes this one step further, enabling you to create fully interactive web apps without having to worry about frontends, backends, or learning an entirely new programming language.
In this tutorial, you will create a simple weather app that fetches data from an API and displays the results in a good-looking app.
Project Overview
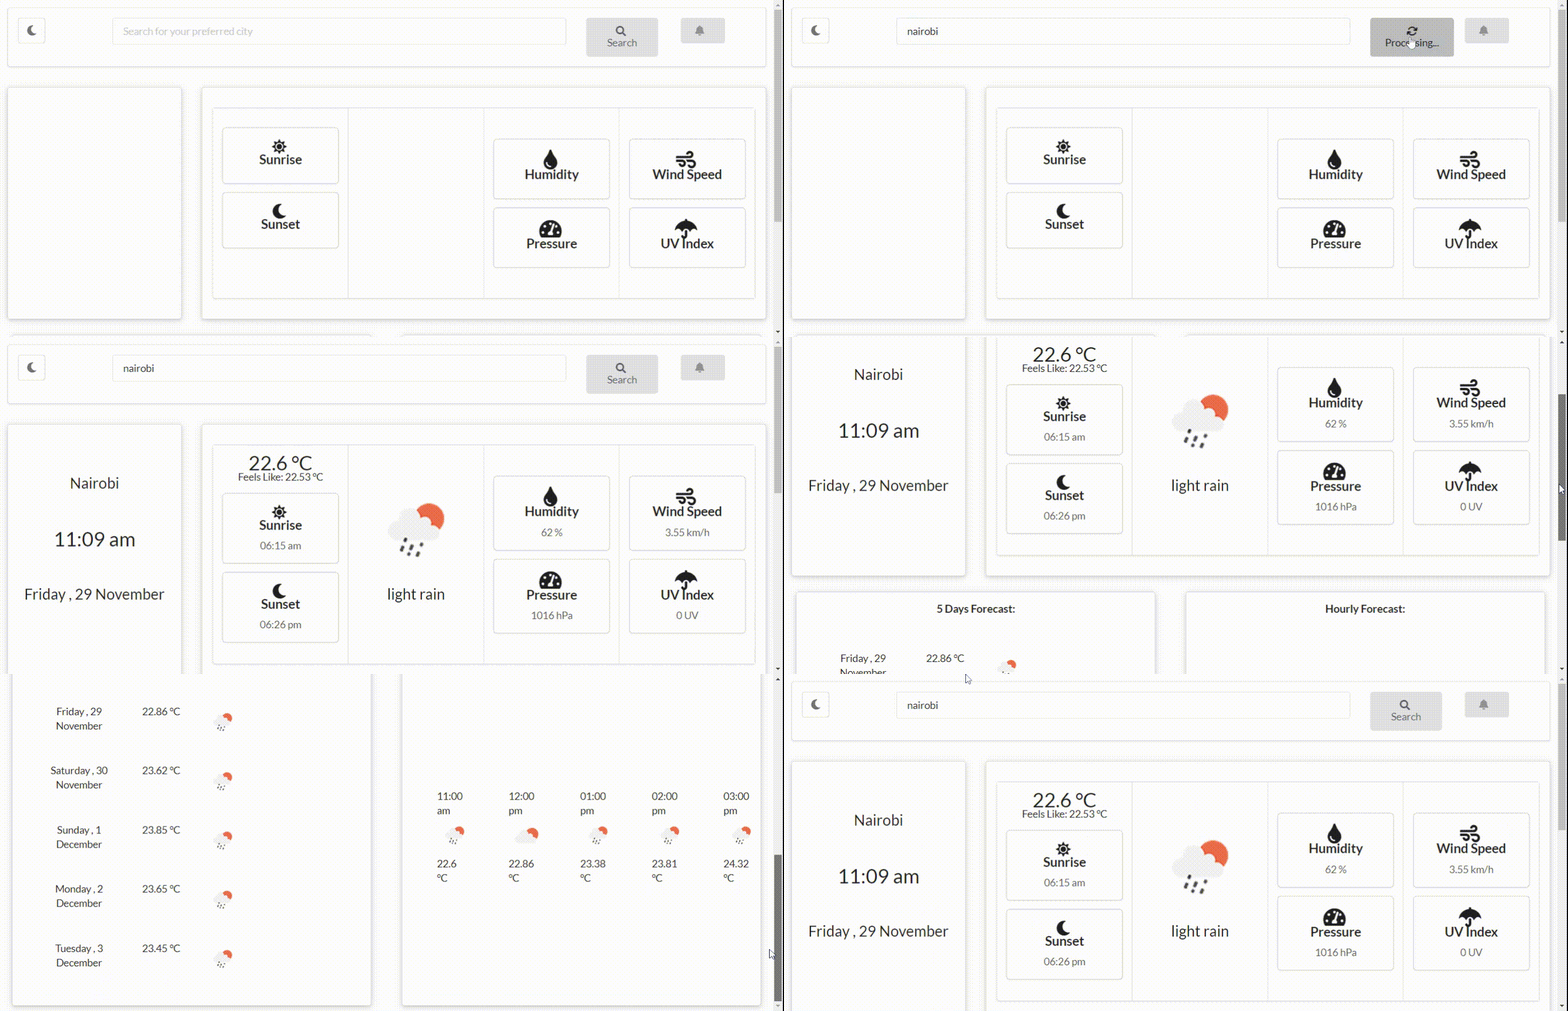
Here’s what we’re going to be building:
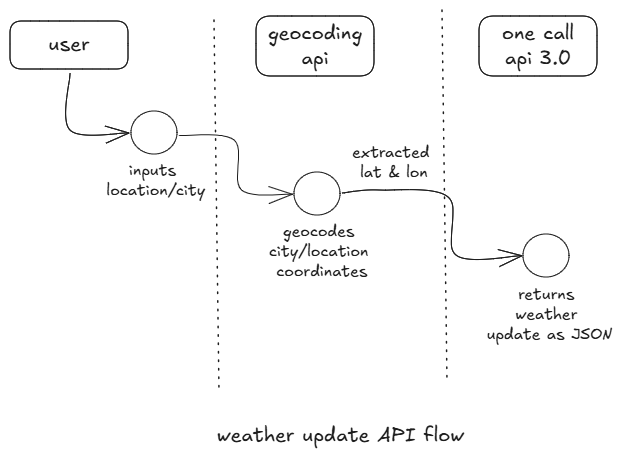
For the weather app to work, you will need to make two separate API calls. We’ll use the One Call API 3.0 to update weather data and the OpenWeather API for geocoding. You can get your API Key here. Just keep in mind that if this is your first time signing up for an API key, activation may take up to 24 hours.
The weather app will take the location/city from user input. The input will then be geocoded by making the call to OpenWeather API. Then, from its response, the coordinates (latitude and longitude) will be extracted. The coordinates will be used as query arguments for the One Call API call to obtain the weather data in JSON format.
Prerequisites
To follow along with this tutorial, you will need:
- R programming knowledge
- HTML and a bit of JavaScript knowledge
- R Studio installed
Project Setup
Create a folder in your desired directory. Set and confirm the project folder as the working directory using the following command in the R console:
setwd("path/to/your/project/file")
getwd()
Create a project in the set path using the following command:
#create R project
usethis::create_project(path = ".", open = FALSE)
You should have a folder structure that looks like this.
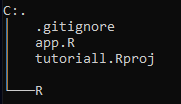
Create an R file in the root directory and save it as app.R. All your R code will be contained here.
Install and load the following libraries that you are going to work with:
library(shiny)
library(bslib)
library(shinyjs)
library(httr2)
library(lubridate)
library(shiny.semantic)
API Keys: Storage and Retrieval
Storing your credentials in a location separate from your scripts and global environment is a good practice. This ensures security, scalability, and flexibility, especially when working in shared or production environments. The .Renviron file best serves that purpose.
Open and edit your .Renviron file in the following way:
#open and edit .Renviron
usethis::edit_r_environ(scope=c("project")
The scope argument set to project sets up the .Renviron specifically to your project. In the newly opened file, add your API key as follows:
OPENWEATHERAPIKEY="yourapikey"
How to Make Your First API Call
You will be using the httr2 library (built based on httr) to obtain data from the API. It grants you more control over how you make requests to the web.
Make the API Key accessible in the script
First, you’ll need to securely access and store the API key in the script without hardcoding it. You can do that like this:
#access API keys in script
readenviron(".Renviron")
api_key = Sys.getenv("OPENWEATHERAPIKEY")
Define the Geocoding Function
You will create a function that takes a location and an API key as inputs, sends a request to the OpenWeather geocoding API, and returns the coordinates of the specified location.
Start by creating a request. The pipe (|>) operator facilitates the chaining of HTTP requests step by step in a clear and readable manner. The geocoding URL takes two parameters: location, denoted by q, and the API key, denoted by app_id. The req_url_query() function appends these parameters to the query.
Chain the query to perform the request and fetch action, and finally obtain the response in JSON format using the second to last line.
# Geocoding URL
geocoding_url <- "https://api.openweathermap.org/data/2.5/weather"
geocode <- function(location, api_key) {
  request(geocoding_url) |>
    req_url_query(`q` = location, `appid` = api_key) |>
    req_perform() |>
    resp_body_json() |>
    coordinates()
}

Define the coordinate-extracting function
The coordinates() function is a helper function that extracts the latitude and longitude values from the JSON response. A quick inspection of the JSON response reveals the coordinate's position. The JSON object is simply a long list of lists and you can access elements by subsetting it.
A blank data body would imply that the city/location is unavailable, and you’d get the message "No such city exists!". If the JSON contains an element, the length would be more than 0 - it is a list after all.
coordinates <- function(body) {
  if(length(body) != 0) {
    lat <- body$coord$lat
    lng <- body$coord$lon
    town <- body$name
    c(lat, lng, town)
  } else {
    "No such city exists!"
  }
}
Define the weather-update function
You will create a function that sends a request to the OpenWeather API with specified query parameters, handles errors using a predefined function, and returns the parsed JSON response containing the weather data.
As implemented in the geocoding function, start by creating a request and adding the necessary query parameters using the req_url_query() function. The openweather_json() function accepts two main arguments:
api_key: This is a required argument used for authentication with the OpenWeather API matched by position....: This represents optional keyword arguments that you can use to customize the query. You can pass as many additional parameters as needed, provided they are specified as named arguments.
openweather_json <- function(api_key, ...) {
  request(current_weather_url) |>
    req_url_query(..., `appid` = api_key, `units` = "metric") |>
    req_error(body = openweather_error_body) |>
    req_perform() |>
    resp_body_json()
}
Error Handling: Extracting and Managing Status Codes
You will create an error-handling function that extracts non-200 status codes from a response and defines how to manage them. The structure of this function depends on how the API reports errors and where the relevant information is stored.
Define the weather-update error body
The req_error() in openweather_json() introduces a new concept: error handling. API requests may throw exceptions, and getting the status codes helps you know what message to show the user and how to resolve it.
Create an error body which is a function that captures the error code if the status code is not 200 (which means everything is OK).
The function takes a response and extracts the status response stored in the JSON response at the $message sublist. The underscore (_)is a placeholder for the JSON object.
openweather_error_body <- function(resp) {
  resp |> resp_body_json() |> _$message
}
Define the geocode error body
This error body function will prove useful in the Shiny App. This is a simple walkthrough.
The req_error() function allows you to customize how response errors are handled. Its is_error argument determines whether a given response should be considered an error. By setting is_error to \(resp) FALSE (an anonymous function that always returns FALSE), all responses, regardless of the status code, are treated as successful. This prevents the app from exiting due to non-200 status codes.
With this setup, you can extract the status code from the response body and pipe it into the resp_status() function to retrieve the exact code.
openstreetmap_error_body <- function(location, api_key) {
  resp <- request(geocoding_url) |>
    req_url_query(`q` = location, `appid` = api_key) |>
    req_error(is_error = \(resp) FALSE) |>
    req_perform() |>  resp_status()
  resp
}
How to Build the Shiny App
Now that you have nailed down how to obtain data from the API, it’s time to render the results in an interpretable and interactive format. For this, you will use Shiny. Shiny is a framework that allows you to create interactive web apps.
A Shiny App is made up of two components:
- The UI: what the user interacts with. It defines the layout and appearance of the app.
- The server: contains the app’s logic and behaviour.
Building the Shiny UI
Shiny UI provides a collection of elements that allow users to input data, make selections, and trigger events seamlessly.
You will include a textInput element that takes in the location and the weather data will be fetched and rendered upon submission. The input_task_button button prevents the user from clicking when an API call is in progress. The other elements are output elements where the weather data will be displayed and a mode-switching button.
Styling the Shiny app
You can use shiny.semantic, a library built on top of Fomantic-UI, to style your Shiny dashboard. Fomantic-UI is a front-end framework that provides a rich collection of pre-styled HTML components like buttons, modals, form inputs, and more. It simplifies UI design by allowing developers to create visually appealing and responsive interfaces without needing extensive custom CSS or HTML knowledge.
Fomantic-UI styling is applied by wrapping elements in their corresponding classes, which define their behavior and appearance.
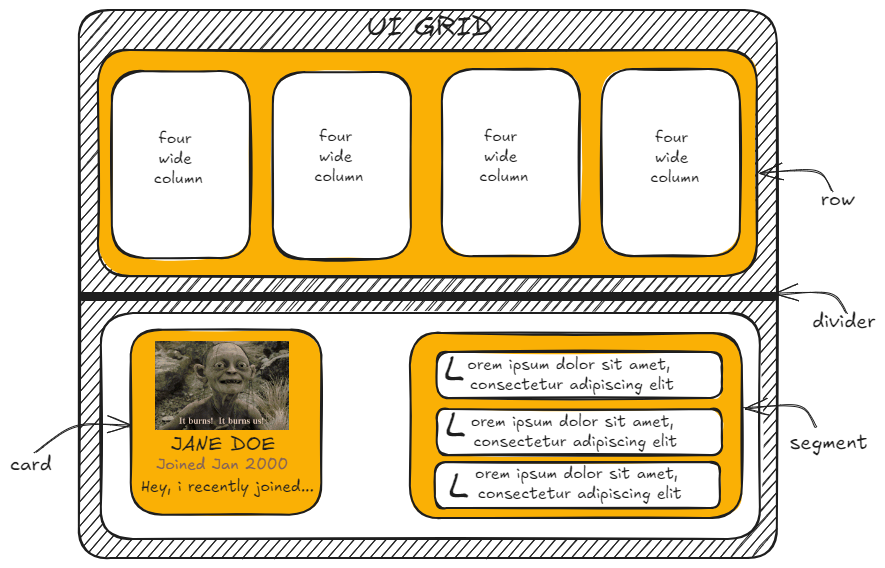
A grid in Fomantic-UI is a flexible layout system used to organize content. It acts as a canvas that divides the layout into rows (horizontally aligned) and columns (vertically aligned). A root grid can contain up to 16 columns, making it ideal for creating structured and responsive designs.
To specify a column's width, you append classes like wide and the size (a number from 1 to 16) to represent its span. The total width of all columns in a row should sum up to 16. A segment groups related content, while a card displays detailed, content-rich items, such as a user's social media profile. Dividers are visual elements used to separate sections or content within a layout.
For the weather app, first create a div of class grid within which you’ll nest the various elements.
Search bar section
Divide the grid into sixteen columns and create a segment that groups elements in the search bar section. Add a theme toggle button, location input that takes in user input, a search button for submitting the location to the API, and a notification button, defining their width by the column size.
div(class = "sixteen wide column",
          div(class = "ui segment",
              div(class = "ui grid",
                  div(class = "two wide column",
                      button(
                        class = "ui button icon basic",
                        input_id = "darkmode",
                        label = NULL,
                        icon = icon("moon icon")
                      )
                  ),
                  div(class = "ten wide column",
                      textInput(
                        "location",
                        label = NULL,
                        placeholder = "Search for your preferred city"
                      )
                  ),
                  div(class = "two wide column",
                      tags$div(
                        class = "ui button",
                        id = "my-custom-button",
                        input_task_button("search", label = "Search", icon = icon("search"))
                      )
                  ),
                  div(class = "two wide column",
                      actionButton("show_alert", label = icon("bell"), class = "bell-no-alert"),
                      textOutput("alert_message")
                  )
              )
          )
      )
Location and current weather section
Divide the grid into sixteen columns and nest another grid within the partitions that will host two columns.
Within the grid, define two columns. The first column is for time, location, and date data, and the second column will hold current weather data.
Then create card elements to hold each weather parameter, its unit of measurement, and the corresponding icon.
div(class = "sixteen wide column",
          div(class = "ui equal-height-grid grid",
              div(class = "left floated center aligned four wide column",
                  div(class = "ui raised equal-height-two-segment segment",
                      style = "flex: 1;",
                      div(class = "column center aligned",
                          div(class = "ui hidden section divider"),
                          span(class = "ui large text", textOutput("city")),
                          div(class = "ui hidden section divider"),
                          span(class = "ui big text", textOutput("currentTime")),
                          div(class = "ui hidden section divider"),
                          span(class = "ui large text", textOutput("currentDate")),
                          div(class = "ui hidden section divider")
                      )
                  )
              ),
              div(class = "right floated center aligned twelve wide column",
                  div(class = "ui raised segment",
                      div(class = "ui horizontal equal width segments",
                          div(class = "ui equal-height-two-segment segment",
                              style = "flex: 3;",
                              div(class = "column",
                                  span(class = "ui big text centered", textOutput("currentTemp")),
                                  textOutput("feelsLike"),
                                  card(
                                    class = "ui mini",
                                    div(class = "content", icon(class = "large sun"),
                                        div(class = "sub header", "Sunrise"),
                                        div(class = "description", textOutput("sunriseTime"))
                                    )
                                  ),
                                  card(
                                    class = "ui mini",
                                    div(class = "content", icon(class = "large moon"),
                                        div(class = "sub header", "Sunset"),
                                        div(class = "description", textOutput("sunsetTime"))
                                    )
                                  )
                              )
                          ),
                          div(class = "ui segment",
                              style = "flex: 3;",
                              div(
                                class = "column center aligned",
                                div(class = "ui hidden divider"),
                                htmlOutput("currentWeatherIcon"),
                                span(class = "ui large text", textOutput("currentWeatherDescription"))
                              )
                          ),
                          div(class = "ui segment",
                              style = "flex: 3;",
                              div(class = "column",
                                  card(
                                    class = "ui tiny",
                                    div(class = "content", icon(class = "big tint"),
                                        div(class = "sub header", "Humidity"),
                                        div(class = "description", textOutput("currentHumidity"))
                                    )
                                  ),
                                  card(
                                    class = "ui tiny",
                                    div(class = "content", icon(class = "big tachometer alternate"),
                                        div(class = "sub header", "Pressure"),
                                        div(class = "description", textOutput("currentPressure"))
                                    )
                                  )
                              )
                          ),
                          div(class = "ui segment",
                              style = "flex: 3;",
                              div(class = "column center aligned",
                                  card(
                                    class = "ui tiny",
                                    div(class = "content", icon(class = "big wind"),
                                        div(class = "sub header", "Wind Speed"),
                                        div(class = "description", textOutput("currentWindSpeed"))
                                    )
                                  ),
                                  card(
                                    class = "ui tiny",
                                    div(class = "content", icon(class = "big umbrella"),
                                        div(class = "sub header", "UV Index"),
                                        div(class = "description", textOutput("currentUV"))
                                    )
                                  )
                              )
                          )
                      )
                  )
              )
          )
      )
Forecast section
This section holds the forecasted data. Divide the grid into sixteen columns and nest another grid within the partitions hosting two columns.
Within the grid, define two columns. The first column holds the 5-Day Forecast data. Separate the elements containing different values using rows. The second column contains Hourly Forecast data. Separate the elements containing different values using columns.
      # Forecast section
      div(class = "sixteen wide column",
          div(class = "ui grid equal-height-grid",
              div(class = "left floated center aligned six wide column",
                  div(class = "ui raised segment special-segment equal-height-segment",
                      h4("5 Days Forecast:"),
                      div(class = "ui three column special-column grid",
                          # Day forecasts
                          div(class = "row",
                              div(class = "five wide column", textOutput("dailyDtOne")),
                              div(class = "three wide column", textOutput("dailyTempOne")),
                              div(class = "three wide column", htmlOutput("dailyIconOne"))
                          ),
                          div(class = "row",
                              div(class = "five wide column", textOutput("dailyDtTwo")),
                              div(class = "three wide column", textOutput("dailyTempTwo")),
                              div(class = "three wide column", htmlOutput("dailyIconTwo"))
                          ),
                          div(class = "row",
                              div(class = "five wide column", textOutput("dailyDtThree")),
                              div(class = "three wide column", textOutput("dailyTempThree")),
                              div(class = "three wide column", htmlOutput("dailyIconThree"))
                          ),
                          div(class = "row",
                              div(class = "five wide column", textOutput("dailyDtFour")),
                              div(class = "three wide column", textOutput("dailyTempFour")),
                              div(class = "three wide column", htmlOutput("dailyIconFour"))
                          ),
                          div(class = "row",
                              div(class = "five wide column", textOutput("dailyDtFive")),
                              div(class = "three wide column", textOutput("dailyTempFive")),
                              div(class = "three wide column", htmlOutput("dailyIconFive"))
                          )
                      )
                  )
              ),
              div(class = "right floated center aligned ten wide column",
                  div(class = "ui raised segment special-segment equal-height-segment",
                      h4("Hourly Forecast:"),
                      div(
                        class = "ui grid",
                        style = "display: flex; flex-direction: row; align-items: center; justify-content: space-around; flex-wrap: wrap; height: 100%;",
                        # Hourly forecasts
                        div(class = "column",
                            textOutput("hourlyDtOne"),
                            htmlOutput("hourlyIconOne"),
                            textOutput("hourlyTempOne")
                        ),
                        div(class = "column",
                            textOutput("hourlyDtTwo"),
                            htmlOutput("hourlyIconTwo"),
                            textOutput("hourlyTempTwo")
                        ),
                        div(class = "column",
                            textOutput("hourlyDtThree"),
                            htmlOutput("hourlyIconThree"),
                            textOutput("hourlyTempThree")
                        ),
                        div(class = "column",
                            textOutput("hourlyDtFour"),
                            htmlOutput("hourlyIconFour"),
                            textOutput("hourlyTempFour")
                        ),
                        div(class = "column",
                            textOutput("hourlyDtFive"),
                            htmlOutput("hourlyIconFive"),
                            textOutput("hourlyTempFive")
                        )
                      )
                  )
              )
          )
      )
  )
Building the Shiny Server
Each element in the UI section has an ID (unique identifier) that is used to manipulate what data/information will be displayed to it.
The render*() set of functions defines the visualization type while the output$* functions subset elements. These two are used to link the visual to the logic. Most elements will have data extracted from the JSON list, except for the weather icons (for which an external link as a source will be referenced).
Reactivity
Reactivity is what makes Shiny apps dynamic—outputs automatically update when their dependencies change.
Two key components of reactivity are reactives and observers. A reactive computes and returns a value based on its dependencies, while an observer monitors reactive values and runs code that causes side effects, like logging or updating a database.
To control reactivity, you can use bindEvent() to delay execution until a specific event occurs or observeEvent() to listen for a user action and trigger a code block. Together, these tools provide flexibility for managing app behavior.
The Server Code
1. location reactive
The location reactive includes an if-else conditional block that defines what message to display depending on the status code. The query variable contains the city/location that will be geocoded to obtain coordinates. The flow is piped to bindEvent(). This ensures the geocoding API call is completed before another call can be made, which reduces unnecessary requests.
location <- reactive({
    query <- input$location
    if(openstreetmap_error_body(query, api_key) == "404"){
      validate("No such city/town exists. Check your spelling!")
    }
    else if(openstreetmap_error_body(query, api_key) == "400"){
      validate("Bad request")
    }
    coords <- geocode(query, api_key)
  }) %>% bindEvent(input$search)
2. weather_data reactive
The weather reactive combines a geocoding API call and a weather update API call using coordinates obtained and extracted from location():
  weather_data <- reactive({
    loc <- location()
    openweather_json(api_key, lat = loc[1], lon = loc[2])
  })
To access the JSON objects returned by the API call, you call the reactive as if it were a function. The specific values to be extracted can then be accessed by subsetting the JSON value.
# subsetting weather data.
  output$city <- renderText({
    location()[3]
  })

  output$currentWeatherDescription <- renderText({
    weather_data()$current$weather[[1]]$description
  })
3. Create a Parse Date function
All the time data in the JSON response, forecasted or current, is provided in UNIX format. To make this information user-friendly, it needs to be converted into a human-readable format. You can do this by creating a function that takes the time data as input and uses functions from the lubridate package to handle the conversion.
First, convert the timestamp element to a datetime object. Format the time item to a 12-hour clock system and a date item to include the day of the week, the date, and the month.
%I: Displays the hour in a 12-hour clock format (01-12).%M: Displays the minutes (00-59).%p: Adds the AM/PM indicator.
The paste function concatenates the values. The function returns a vector containing date and time values to be extracted by subsetting.
parse_date <- function(timestamp) {
  datetime <- as_datetime(timestamp)
  date <- paste(weekdays(datetime), ",", day(datetime), months(datetime))
  time <- format(as.POSIXct(datetime), format = "%I:%M %p")
  c(date, time)
}
4. Add a modal to display error messages
The location reactive provides a way to handle errors. You can incorporate a modal to enhance the user experience by overlaying the page and disabling its content until the user completes a specified action whenever an error occurs.
You’ll add JavaScript to control when and how the modal shows.
Add two modals in the UI section, each featuring an explanation of the error (header) and an outline of the required action (content). The action class includes a button that enables the user to close the modal.
# modals - UI
  div(id = "notFound", class = "ui modal",
      div(class = "header", "Location Not Found"),
      div(class = "content", "No such city/town exists. Check your spelling!"),
      div(class = "actions",
          div(class = "ui button", id = "closeNotFound", "OK"))
  ),
  div(id = "badRequest", class = "ui modal",
      div(class = "header", "Invalid Request"),
      div(class = "content", "Bad request. Please try again with valid details."),
      div(class = "actions",
          div(class = "ui button", id = "closeBadRequest", "OK"))
  )
Slightly adjust the location reactive to incorporate the modal. The commented-out code will be replaced with the JavaScript lines. The runjs function shows the modal depending on the error encountered. req(FALSE) terminates the reactive flow.
# show and hide modals  - Server
location <- reactive({
    query <- input$location
    if(openstreetmap_error_body(query, api_key) == "404"){
      #validate("No such city/town exists. Check your spelling!")
      runjs("$('#notFound').modal('show');")
      req(FALSE)
    }
    else if(openstreetmap_error_body(query, api_key) == "400"){
      #validate("Bad request")
      runjs("$('#badRequest').modal('show');")
      req(FALSE)
    }
    coords <- geocode(query, api_key)
  }) %>% bindEvent(input$search)

# listens for button click on modals to hide modal
observeEvent(input$closeNotFound, {
    runjs("$('#notFound').modal('hide');")
  })

observeEvent(input$closeBadRequest, {
    runjs("$('#badRequest').modal('hide');")
  })
Conclusion
In this tutorial, you have built a weather app using Shiny that retrieves weather data from an API and displays it in an interactive and visually appealing way.
To do this, you used the following libraries:
httr2for making API requests and handling responsesshiny.semanticfor styling the applubridatefor working with and formatting time datashinyjsfor integrating JavaScript features into the app
This combination of tools allowed you to create a functional, user-friendly weather app.
You can find the complete code for the project here (elabongaatuo/R-weather-app).
La Fin!