
How to Visualize the results
How to Visualize the results 관련

I wanted to use the terminal as much as possible to visualize my findings, and to keep requirements to a minimum. I decided to use the Textual framework to accomplish that.
This framework is very complete and allows you to build text applications that are responsive and beautiful to look at.
They are also easy to write, so before we go deeper into the resulting applications, let's pause to learn about Textual.
Text User Interfaces (TUI) with Textual
The Textual project has a nice tutorial that you can read to get up to speed.
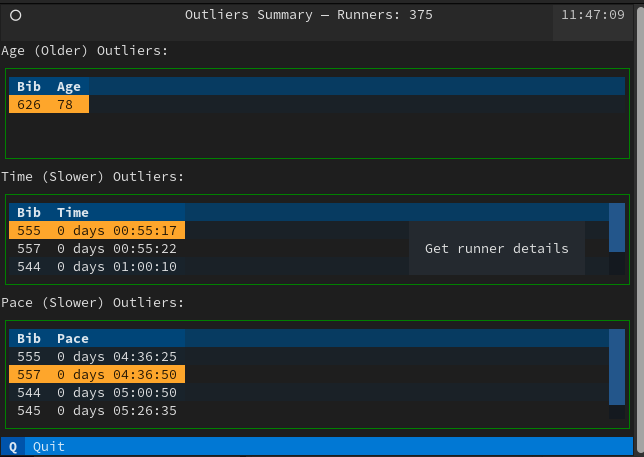
Let's see some code. One of the applications is called esru_outlier. TUI code lives on the apps (josevnz/tutorials) module that shows several tables together with the outliers we found before, using the z-score.
OutlierApp (extends App) collects all the basic information on a table for each outlier group and then calls the RunnerDetailScreen to display details about a runner.
Next is code with explanations that shows how to build this screen:
# Only the code of the application shown here
# This application shows 3 tables: SUMMARY_METRICS = (RaceFields.AGE.value, RaceFields.TIME.value, RaceFields.PACE.value)
# Every application in Textual extends the App class
class OutlierApp(App):
    DF: DataFrame = None
    BINDINGS = [ ("q", "quit_app", "Quit"), ]  # Bind 'q' to 'quit_app' method `action_quit_app`, which in turn exists the app
    CSS_PATH = "outliers.tcss"  # Styling can be done externally, similar to using CSS
    ENABLE_COMMAND_PALETTE = False

    def action_quit_app(self):
        self.exit(0)

    def compose(self) -> ComposeResult:
        """
        Here we 'Yield' Widgets/ components that will be rendered in order on the TUI
        How do the components get their layout on the screen? They use a cascading style sheet (CSS): outliers.tcss and
        some explicit layout containers like the class `Vertical` that can contain other Widgets
        Here we have a header, tables, and a footer
        """
        yield Header(show_clock=True)
        for column_name in SUMMARY_METRICS:
            table = DataTable(id=f'{column_name}_outlier')
            table.cursor_type = 'row'
            table.zebra_stripes = True
            table.tooltip = "Get runner details"
            if column_name == RaceFields.AGE.value:
                label = Label(f"{column_name} (older) outliers:".title())
            else:
                label = Label(f"{column_name} (slower) outliers:".title())
            yield Vertical(
                label,
                table
            )
        yield Footer()

    def on_mount(self) -> None:
        """
        Here we populate each table with data from the DataFrame. Each table has outliers of different types.
        All can be obtained with the `get_outliers` method.
        """
        for column in SUMMARY_METRICS:
            table = self.get_widget_by_id(f'{column}_outlier', expect_type=DataTable)
            columns = [x.title() for x in ['bib', column]]
            table.add_columns(*columns)
            table.add_rows(*[get_outliers(df=OutlierApp.DF, column=column).to_dict().items()])

    @on(DataTable.HeaderSelected)
    def on_header_clicked(self, event: DataTable.HeaderSelected):
        """
        When the user selects a column header it generates a 'HeaderSelected' event.
        The annotation on this method tells Textual that we will handle this event here
        We can extract the table, the selected column, and then sort the table contents.
        """
        table = event.data_table
        table.sort(event.column_key)

    @on(DataTable.RowSelected)
    def on_row_clicked(self, event: DataTable.RowSelected) -> None:
        """
        Similarly, when the user selects a row it generates a RowSelected method
        What we do on the 'on_row_clicked' method is capture the event, get the row contents, and construct
        a new modal screen (RunnerDetailScreen) which we push on top of the regular screen.
        There we show the runner details differently.
        """
        table = event.data_table
        row = table.get_row(event.row_key)
        runner_detail = RunnerDetailScreen(df=OutlierApp.DF, row=row)
        self.push_screen(runner_detail)
The class RunnerDetailScreen (extends ModalScreen) handles showing the racer details using formatted Markdown, which shows up when you click on the table that was rendered before:
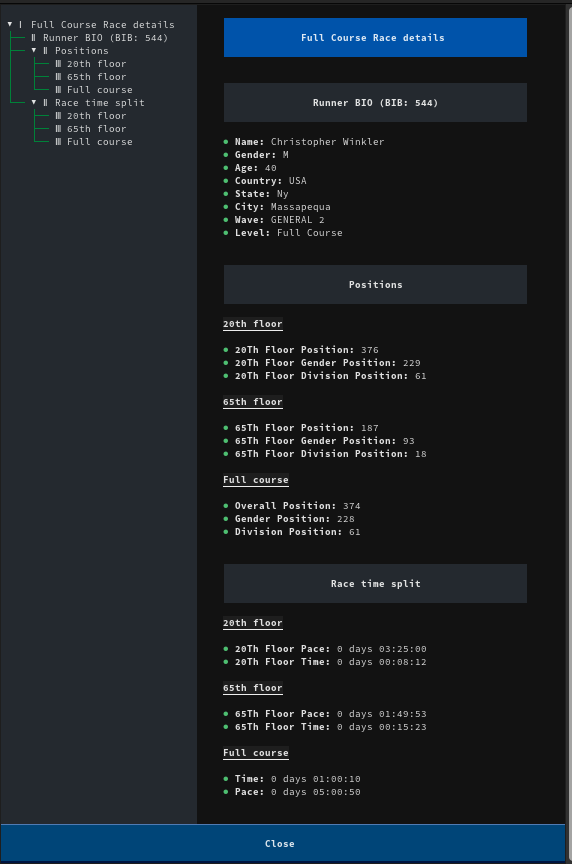
Rendered Markdown with details about the selected runner
And here's the code that allows that with explanations:
# Omitted imports and helper methods, only showing TUI-related code. See the 'apps.py' file for full code
class RunnerDetailScreen(ModalScreen):
    ENABLE_COMMAND_PALETTE = False  # Disable the search bar, it is active by default and is not needed here
    CSS_PATH = "runner_details.tcss"  # Handle the styles using external CSS

    def __init__(
            self,
            name: str | None = None,
            ident: str | None = None,
            classes: str | None = None,
            row: List[Any] | None = None,
            df: DataFrame = None,
            country_df: DataFrame = None
    ):
        """
        Override the constructor and load useful data like country ISO codes
        We get the Pandas DataFrame with the details that will be shown to the user
        """
        super().__init__(name, ident, classes)
        self.row = row
        self.df = df
        if not country_df:
            self.country_df = load_country_details()
        else:
            self.country_df = country_df

    def compose(self) -> ComposeResult:
        """
        In compose we prepare the markdown, and we let the MarkdownViewer handle details like
        a nice automatic table of contents.
        Notice that we call `self.log.info('xxx'). We use that for debugging when this application
        is called using 'textual'.
        """
        bib_idx = FIELD_NAMES_AND_POS[RaceFields.BIB]
        bibs = [self.row[bib_idx]]
        columns, details = df_to_list_of_tuples(self.df, bibs)
        self.log.info(f"Columns: {columns}")
        self.log.info(f"Details: {details}")
        row_markdown = ""
        position_markdown = {}
        split_markdown = {}
        for legend in ['full', '20th', '65th']:
            position_markdown[legend] = ''
            split_markdown[legend] = ''
        for i in range(0, len(columns)):
            column = columns[i]
            detail = details[0][i]
            if re.search('pace|time', column):
                if re.search('20th', column):
                    split_markdown['20th'] += f"\n* **{column.title()}:** {detail}"
                elif re.search('65th', column):
                    split_markdown['65th'] += f"\n* **{column.title()}:** {detail}"
                else:
                    split_markdown['full'] += f"\n* **{column.title()}:** {detail}"
            elif re.search('position', column):
                if re.search('20th', column):
                    position_markdown['20th'] += f"\n* **{column.title()}:** {detail}"
                elif re.search('65th', column):
                    position_markdown['65th'] += f"\n* **{column.title()}:** {detail}"
                else:
                    position_markdown['full'] += f"\n* **{column.title()}:** {detail}"
            elif re.search('url|bib', column):
                pass  # Skip uninteresting columns
            else:
                row_markdown += f"\n* **{column.title()}:** {detail}"
        yield MarkdownViewer(f"""# Full Course Race details ---

## Runner BIO (BIB: {bibs[0]})
{row_markdown}
---

## Positions
---

## 20th floor
{position_markdown['20th']}
---

## 65th floor
{position_markdown['65th']}
---

## Full course
{position_markdown['full']}            ---

## Race time split
---

## 20th floor
{split_markdown['20th']}
---

## 65th floor
{split_markdown['65th']}
---

## Full course
{split_markdown['full']}
        """)
        # This button is used to close this screen and send the user to the previous screen
        btn = Button("Close", variant="primary", id="close")
        btn.tooltip = "Back to main screen"
        yield btn

    @on(Button.Pressed, "#close")
    def on_button_pressed(self, _) -> None:
        """
        Simple logic, pop the previous screen and make this one disappear
        """
        self.app.pop_screen()
This class is reusable. There are other classes (like BrowserApp in this tutorial) that also send data when a user clicks on a table row, and those details get displayed using this modal screen.
We can customize the appearance using CSS (yes, like a web application). It looks a lot like a web application's CSS (but it's not exactly the same). For example to add style to a button, here's the code:
button {
  dock: bottom;
  width: 100%;
  height: auto;
}
As you can see, Textual is a pretty powerful framework. It reminds me a lot of Java Swing, but without the extra complexity.
But is it just information in tabular format? I also wanted to have different graph types that could explain behavior like age cluster and gender distribution. For that, I wrote a few classes on the 'apps' module with the help of Matplotlib.
Plots with Matplotlib
I wanted to use some charts to display the data, and I made them with matplotlib. The code to generate an age plot box, that shows how old the participating runners were, is very straightforward.
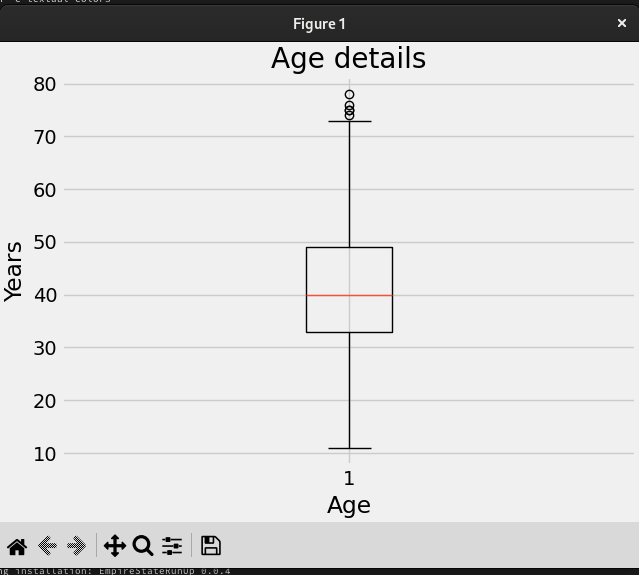
Age box plot in Matplotlib that shows than most of the runners were in the 40-50 year old range.
And here's the code that produced that plot:
# Not all code is shown here (helper methods, imports)
# Please check the apps.py module to see all missing code
class Plotter:
    def plot_gender(self):
        """
        In this method, we get our data frame filtering by gender and get counts
        Then we create a pie plot
        """
        series = self.df[RaceFields.GENDER.value].value_counts()
        fig, ax = plt.subplots(layout='constrained')
        wedges, texts, auto_texts = ax.pie(
            series.values,
            labels=series.keys(),
            autopct="%%%.2f",
            shadow=True,
            startangle=90,
            explode=(0.1, 0, 0)
        )
        ax.set_title = "Gender participation"
        ax.set_xlabel('Gender distribution')

        # Legend with the fastest runners by gender
        fastest = find_fastest(self.df, FastestFilters.Gender)
        fastest_legend = [f"{fastest[gender]['name']} - {beautify_race_times(fastest[gender]['time'])}" for gender in
                          series.keys()]
        ax.legend(wedges, fastest_legend,
                  title="Fastest by gender",
                  loc="center left",
                  bbox_to_anchor=(1, 0, 0.5, 1))
Interesting - most of the runners were between 40-50 years old.
Now let's go back to testing TUI.
Testing the User Interfaces
When I started working on this small project, I knew that there was going to be a lot of testing. What I wasn't sure about was how I would be able to test the TUI.
I figured at least two ways would be useful with Textual: one being able to see the message flow between components and the other using unit tests with a twist:
Following the message flow with Textual
Textual supports an interesting development mode that allows you to change CSS and see the changes on your application without a restart. Also, you can see how the TUI events propagate, which is invaluable for debugging.
In one terminal, start the console:
. ~/virtualenv/EmpireStateRunUp/bin/activate
textual console
#
# ▌Textual Development Console v0.46.0
# ▌Run a Textual app with textual run --dev my_app.py to connect.
# ▌Press Ctrl+C to quit.
Then in another terminal, start your application but using development mode:
textual run --dev --command esru_browser
If you check back on your console terminal, you will see any messages you sent with App.log along with the events:
─────────────────────────────────────────────────────────────────────────── Client '127.0.0.1' connected ───────────────────────────────────────────────────────────────────────────
[18:28:17] SYSTEM                                                                                                                                                        app.py:2188
Connected to devtools ( ws://127.0.0.1:8081 )
[18:28:17] SYSTEM                                                                                                                                                        app.py:2192
---
[18:28:17] SYSTEM                                                                                                                                                        app.py:2194
driver=<class 'textual.drivers.linux_driver.LinuxDriver'>
[18:28:17] SYSTEM                                                                                                                                                        app.py:2195
loop=<_UnixSelectorEventLoop running=True closed=False debug=False>
[18:28:17] SYSTEM                                                                                                                                                        app.py:2196
features=frozenset({'debug', 'devtools'})
[18:28:17] SYSTEM                                                                                                                                                        app.py:2228
STARTED FileMonitor({PosixPath('/home/josevnz/EmpireStateCleanup/docs/EmpireStateRunUp/empirestaterunup/browser.tcss')})
[18:28:17] EVENT                                                                                                                                                 message_pump.py:706
Load() >>> BrowserApp(title='Race Runners', classes={'-dark-mode'}) method=None
[18:28:17] EVENT                                                                                                                                                 message_pump.py:697
Mount() >>> DataTable(id='runners') method=<ScrollView.on_mount>
[18:28:17] EVENT                                                                                                                                                 message_pump.py:697
Mount() >>> DataTable(id='runners') method=<Widget.on_mount>
[18:28:17] EVENT                                                                                                                                                 message_pump.py:697
Mount() >>> Footer() method=<Footer.on_mount>
[18:28:17] EVENT                                                                                                                                                 message_pump.py:697
Mount() >>> Footer() method=<Widget.on_mount>
[18:28:17] EVENT                                                                                                                                                 message_pump.py:697
Mount() >>> ToastRack(id='textual-toastrack') method=<Widget.on_mount>
...
RowHighlighted(cursor_row=0, row_key=<textual.widgets._data_table.RowKey object at 0x7fc8d98800d0>) >>> BrowserApp(title='Race Runners', classes={'-dark-mode'}) method=None
[18:28:17] EVENT                                                                                                                                                 message_pump.py:697
Mount() >>> ScrollBarCorner() method=<Widget.on_mount>
[18:28:17] EVENT                                                                                                                                                 message_pump.py:706
Resize(size=Size(width=2, height=1), virtual_size=Size(width=178, height=47), container_size=Size(width=178, height=47)) >>> ScrollBarCorner() method=None
[18:28:17] EVENT                                                                                                                                                 message_pump.py:706
Show() >>> ScrollBarCorner() method=None
Using unittest and Pilot
The framework has the Pilot class that you can use to make automated calls to Textual Widgets and wait for events. This means you can simulate user interaction with the application to validate that it behaves as expected. This is more powerful than the regular unit tests as you can also cover UI interactions with expected results:
import unittest
from textual.widgets import DataTable, MarkdownViewer
from empirestaterunup.apps import BrowserApp


class AppTestCase(unittest.IsolatedAsyncioTestCase):
    async def test_browser_app(self):
        app = BrowserApp()
        self.assertIsNotNone(app)
        async with app.run_test() as pilot:

            """
            Test the command palette
            """
            await pilot.press("ctrl+\\")
            for char in "jose".split():
                await pilot.press(char)
            await pilot.press("enter")
            # This returns the runner screen. Check that it has some contents
            markdown_viewer = app.screen.query(MarkdownViewer).first()
            self.assertTrue(markdown_viewer.document)
            await pilot.click("#close")  # Close the new screen, pop the original one
            # Go back to the main screen, now select a runner but using the table
            table = app.screen.query(DataTable).first()
            coordinate = table.cursor_coordinate
            self.assertTrue(table.is_valid_coordinate(coordinate))
            await pilot.press("enter")
            await pilot.pause()
            markdown_viewer = app.screen.query(MarkdownViewer).first()
            self.assertTrue(markdown_viewer)
            # After validating the markdown one more time, close the app
            # Quit the app by pressing q
            await pilot.press("q")

if __name__ == '__main__':
    unittest.main()
This is invaluable, and something that many times requires an external toolset to validate (for example in Java you have the class Robot).